

Introduction
Mobile eCommerce Statistics: Recent mobile eCommerce statistics indicate that an increasing number of consumers prefer to shop on smartphones. It has transformed the shopping experience by enabling consumers to make purchases anytime, anywhere. With ongoing technological advancements, mobile usage has increased rapidly in recent years. All analyses indicate that the majority of consumers now rely on smartphones to fulfil their shopping experiences. In addition, high-speed mobile internet enables users to browse products, compare prices, and complete transactions without visiting physical stores.
Overall, the article details the use cases of mobile eCommerce and enhances convenience in online shopping by enabling businesses to engage customers through secure payments, digital wallets, and personalised mobile experiences, making it vital to modern retail growth.
Editor’s Choice
- U.S. retail mobile commerce sales are projected to reach USD 744.71 billion in 2026 and increase further to USD 856.38 billion in 2027.
- According to Appetiser, in the United States, smartphones accounted for 77% of retail website visits and 68% of online orders in Q3 2025.
- Mobile shopping apps grow faster than others; users spend 48% more time on them.
- In 2025, Amazon leads the mobile e-commerce space with 651.7 million monthly active users.
- Smartphone use for U.S. mobile eCommerce is highest among ages 30-49 (92%).
- Statista reported that 30% of the global digital population, or about 1.65 billion people, shop on mobile phones as of 2025.
- The number of smartphone users worldwide was approximately 5.27 billion in 2025 and is projected to reach 5.64 billion by 2026.
- According to MobiLoud, 3 out of 4 consumers shop on mobile devices to save time.
- PayPal leads eCommerce mobile wallet use at 36%, followed by Apple Pay at 18% and Other wallets at 17%.
- South Korea is forecast to lead APAC mobile eCommerce in 2026, capturing the highest share at 77%, followed by China (76%) and Indonesia (70%).
- Only 12% of consumers find mobile web shopping convenient, while 57% avoid recommending brands with poor mobile websites.
- Around 90% of American shoppers already use AR or are willing to use it when making buying decisions.
- Franetic reports stated that more than 20% of mobile shopping searches are conducted via voice globally.
- In 2026, the main reason people choose mobile shopping is that about 73% of consumers prefer buying on their phones because it’s easy and accessible throughout the day.
- In 2025, North American shoppers primarily used smartphones to compare prices (72%) and read customer reviews (69%).
Key Takeaways

(Source: digitalsilk.com)
- As of 2025, smartphones accounted for 77% of global retail website traffic and generated 68% of global retail orders.
- In the U.S. mobile eCommerce market accounted for USD 776 billion.
- Around 76% of U.S. adults have made at least one purchase on a smartphone.
- In North America, 72% of adults use smartphones to compare prices while shopping in physical stores.
- Mobile devices contribute to 61% of total eBay sales globally.
- In Canada, mobile commerce is valued at USD 62 billion, and by 2026, 42% of all eCommerce sales will come from mobile devices.
- The U.K. is expected to see 57.6% of all eCommerce purchases made via mobile by 2027.
- The Australian mobile commerce segment accounted for USD 15.2 billion, with a 36% of total eCommerce.
- 66% of Millennials and 65% of Gen Z shop weekly on mobile.
- As of 2025, Latin America recorded mobile retail sales of USD 106.82 billion.
- Japan’s mobile e-commerce market accounted for 6.65 trillion yen.
- By 2026, 77% of South Korea’s eCommerce sales will be mobile-driven, while smartphones generate 70% of eCommerce orders in Nordic countries.
- According to Seller Commerce, around 30% of people worldwide shop using mobile phones, representing 1.65 billion users.
- In the United States, 76% of adults make purchases on smartphones.
- Globally, shoppers spend more than 41.9 billion hours using mobile shopping apps.
- In 2025, mobile shopping transactions averaged USD 120 using digital wallets and gateways.
Global Mobile Commerce Sales Growth
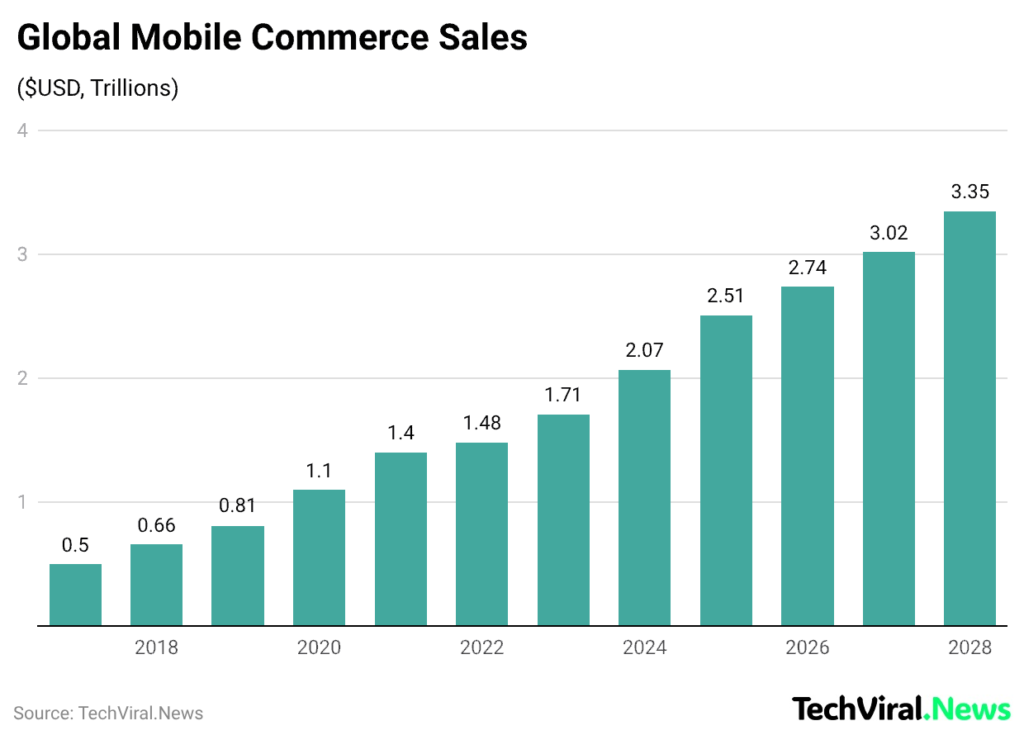
(Reference: oyelabs.com)
- Global mobile commerce sales reached USD 2.51 trillion in 2025.
- The market is projected to increase further to USD 2.74 trillion by 2026, followed by USD 3.02 trillion (2027) and USD 3.36 trillion (2028).
- The sales share is expected to reach 60% in 2026, 62% in 2027, 63% in 2028.
By Retail Sales
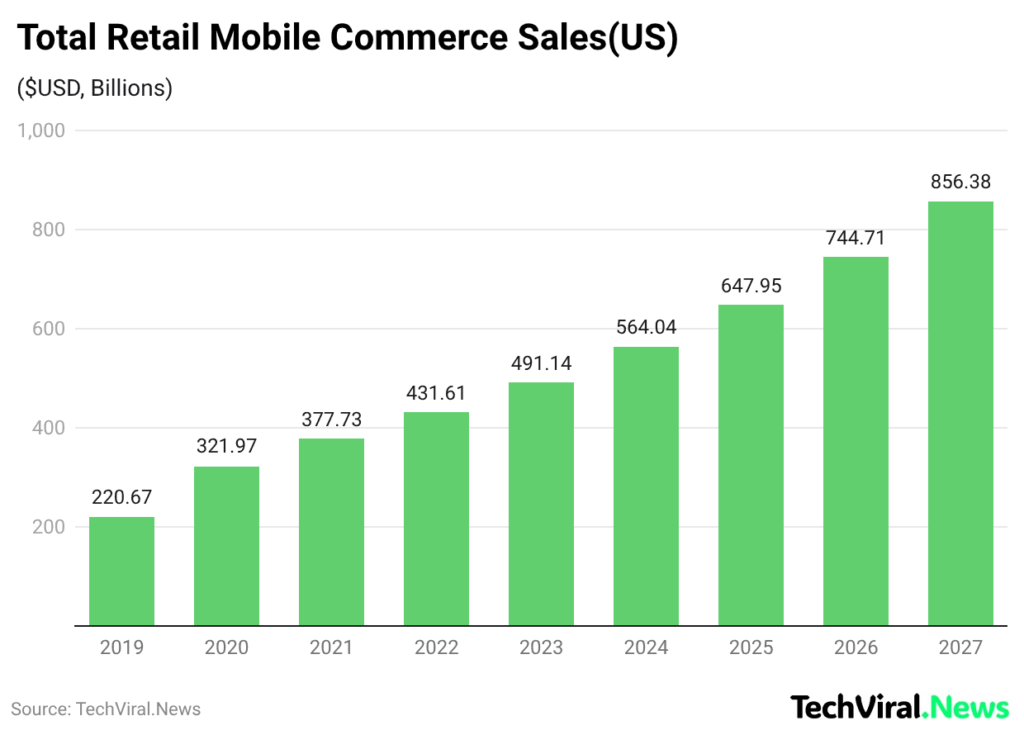
(Reference: mobiloud.com)
- U.S. retail mobile commerce sales are projected to reach USD 744.71 billion in 2026 and increase further to USD 856.38 billion in 2027.
- Mobile commerce accounts for 38% of total digital spending across the United States.
- Tidio’s report further stated that the U.S. mobile commerce share of total retail sales reached 7.9% in 2025 and is projected to increase to 8.7% in 2026.
Mobile eCommerce Statistics By Regional Insights
United States
- According to Appetiser, in the United States, smartphones accounted for 77% of retail website visits and 68% of online orders in Q3 2025, reflecting a 20% year-over-year increase in mobile shopping.
- Although 80% of customer service teams plan to move away from native apps by 2025.
- U.S. social commerce reached nearly USD 80 billion, and over 100 million Americans are expected to scan QR codes by 2025.
Europe
- The market reached USD 12.60 billion in 2025, while Europe’s rapid-delivery market is expected to grow at a 7.05% CAGR (2025–2029), reaching USD 16.54 billion GMV by 2029.
- Online sales across Europe-5 are forecast to grow at an annual rate of 7.8%, rising from EUR 389 billion in 2024 to EUR 565 billion by 2029.
- In the UK, the online retail share will reach 32% by 2029.
Australia
- 95% of Australians shopped using smartphones, with Gen X (99%) and Millennials (97%) leading, whereas 79% of Boomers still rely on desktops for research-focused purchases.
- Digital commerce accounted for USD 57.65 billion in 2025 at a 6.53% CAGR.
- Moreover, 57% want same-day collection, 77% seek real-time tracking, and 44% abandon carts if delivery takes more than two days.
eCommerce Mobile App Statistics
- Shopping apps grow faster than others; users spend 48% more time on them.
- Moreover, 31% of consumers prefer shopping apps to physical stores.
- The U.S. survey found that 90% of users had multiple shopping apps installed, including 48% with two to four apps, 29% with five to nine apps, and 13% with ten or more.
- The study also revealed that 49% would download a new app for special offers, while 1 in 20 fraud attacks comes from harmful apps.
By Monthly Active Users
- According to LinkedIn, in 2025, Amazon leads the mobile eCommerce space with 651.7 million monthly active users, followed by Shopee (392.8 million), Temu (246.4 million), and Shein (215.1 million).
- Other major platforms are Flipkart (190.8 million), AliExpress and Meesho (159 million each), Mercado Libre (125.3 million), Lazada (109.2 million), and Walmart (93.9 million monthly users).
By Usage
| Consumer Group/Behaviour | Mobile Shopping App Usage |
| American Consumers (Overall) | 88% have at least one shopping app installed |
| App Volume on Smartphones | 50% have more than 4 apps; 9% have over 10 apps |
| Age Group 18-44 | 96% have at least one app; 61% use more than 4 apps |
| Consumers Over 45 | 75% have at least one app; 39% have more than 4 apps |
| Regular Mobile Shoppers | 10% have at least 5 eCommerce apps |
| Daily App Users | 15% use shopping apps every day |
| Weekly & Monthly Usage | 37% use apps a few times weekly; 26% use them monthly |
U.S. Smartphone Usage By Age Group
- Capital One Shopping Research observed that smartphone use for U.S. mobile eCommerce is highest among ages 30-49 (92%) and ages 18-29 (87%), while the overall rate for all adults 18+ is 76%.
- Smartphone usage declines with age: 69% among ages 50-64 and 48% among ages 65+.
Revenue Per Download For Shopping Apps
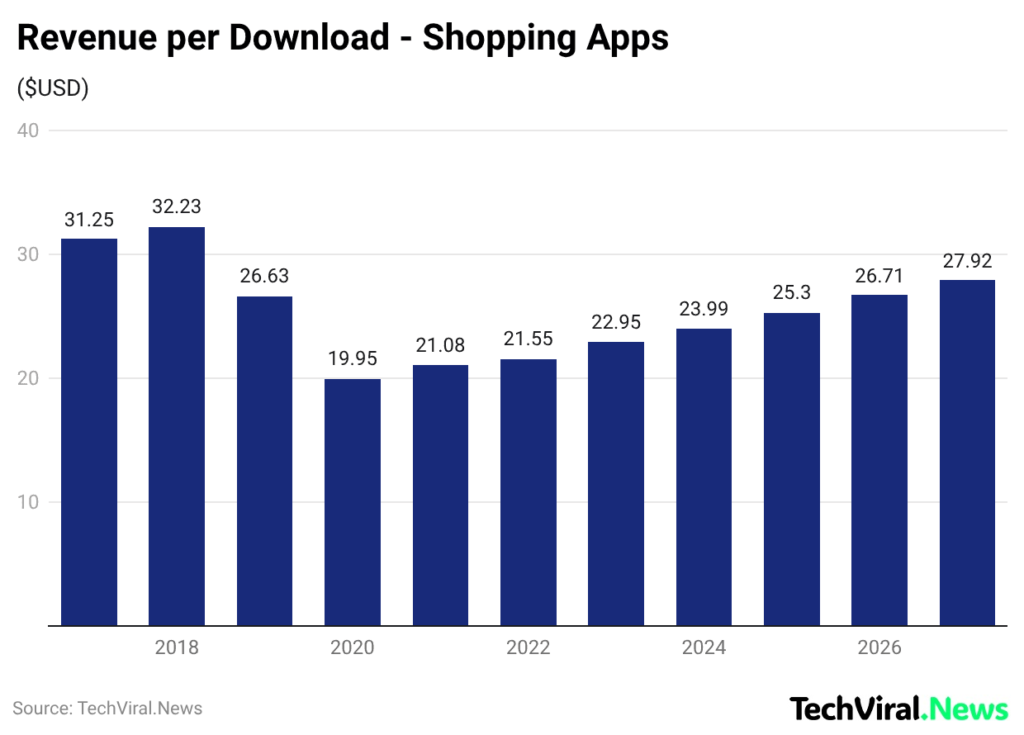
(Reference: mobiloud.com)
- Revenue per shopping app download amounted to USD 25.30 in 2025.
- This value is expected to rise further to USD 26.71 by 2026 and USD 27.92 by 2027.
Global Trends And Consumer Behaviour Analyses
- Statista reported that 30% of the global digital population, or about 1.65 billion people, shop on mobile phones as of 2025.
- Exploding Topics stated that mobile devices also accounted for nearly 60% of total internet traffic, with the Food & Beverage sector recording the highest mobile search share at 72%, compared with banking at 39%.
- Mobile commerce accounted for 59% of total retail eCommerce sales, valued at USD 4.01 trillion in 2025, while 60% of the global population now uses smartphones, according to Priori Data.
- Globally, there are more than 4.8 billion smartphone users, representing nearly 59% of the global population.
- Shopify’s report stated that in the United States, 76% of adults (approximately 200 million users) shop via smartphones, and 92% of mobile shoppers under 50 actively purchase online.
- The Economic Times report also stated that, additionally, more than 60% of consumers prefer shopping apps to mobile websites, and 62% have purchased products through social commerce platforms.
Smartphone User Statistics
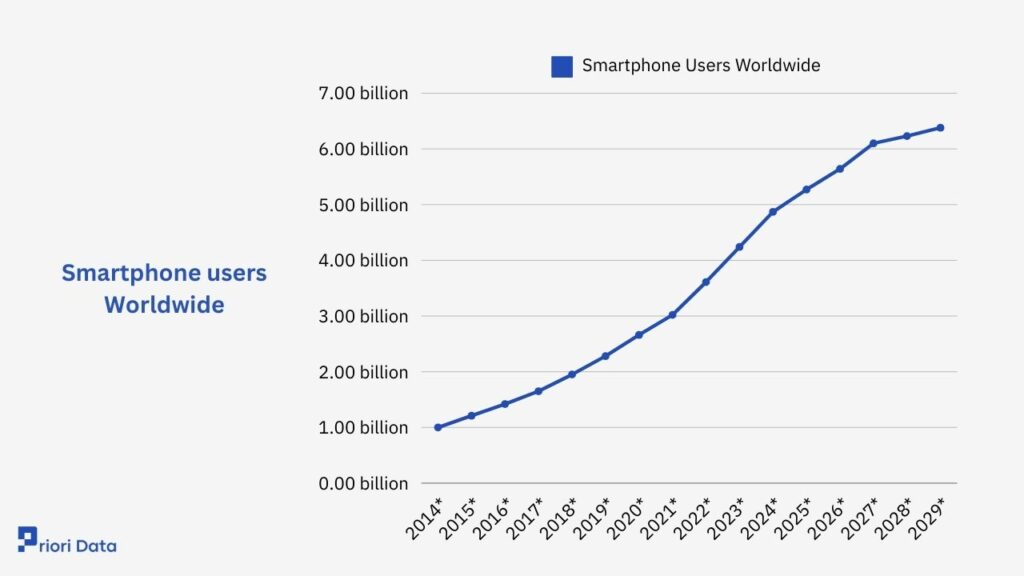
(Source: prioridata.com)
- The total number of smartphone users worldwide was approximately 5.27 billion in 2025 and is projected to reach 5.64 billion by 2026.
- This growth is projected to continue, reaching 6.10 billion in 2027, 6.23 billion in 2028, and 6.38 billion in 2029.
Digital Shopping And Payment Insights
- According to MobiLoud, 3 out of 4 consumers shopped via mobile devices to save time.
- Meanwhile, 74% of U.S. shoppers research products on smartphones in-store.
- Additionally, 49% of global online transactions use digital wallets, 61% of Google searches originate from mobile devices.
- Only 15% of American adults rely exclusively on smartphones for internet access.
- The Retail Exec also stated that, in 2025, digital wallets are expected to account for 52.5% of online transaction value, and that 45% of mobile transactions are processed through mobile apps.
- Mobile wallets are projected to account for over 50% of all e-commerce payments by 2027.
- Only 10% of mobile transactions in 2025 employed biometric authentication. Apple Pay, Google Pay, and PayPal drive the platform.
Most Used Mobile Wallets
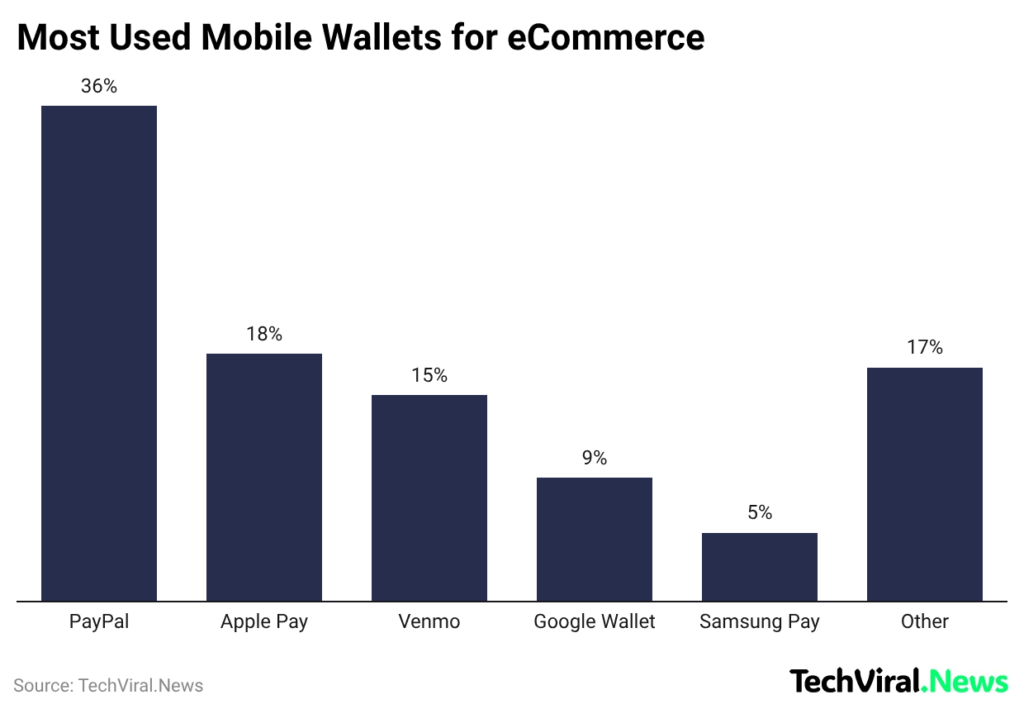
(Reference: imagedelivery.net)
- PayPal leads eCommerce mobile wallet use at 36%, followed by Apple Pay at 18% and Other wallets at 17%.
- Other usage share includes Venmo (15%), Google Wallet (9%), and Samsung Pay (5%), showing a clear drop after the top options.
Performance Analyses
- According to SimiCart, desktop converts better at 3% vs. 2% on mobile, yet apps beat mobile sites: shopping apps convert 3.5% while mobile web stays at 2%.
- In the Asia-Pacific region, app conversion rates can be up to 6 times higher, and app orders run 10% above mobile web orders.
- Cart abandonment is worst on mobile sites at 85.65%, compared with 73% on desktops.
- App shoppers view 4.2 times more products and spend 201.8 minutes a month, versus 10.9 minutes on mobile web.
- Apps take 90% of mobile time and are growing 54% year over year.
- Mobile drives 65% of e-commerce traffic (70% in fashion) and over 60% of Google searches; by 2026, it will reach 78%.
Mobile Shopping Experience And User Challenges
- Only 12% of consumers find mobile web shopping convenient, while 57% avoid recommending brands with poor mobile websites.
- In addition, 67% struggle with small links on mobile pages.
- Notably, 80% of new shopping app users discontinue use within 4 weeks.
Global E-Commerce Market Share Statistics By Digital Wallets
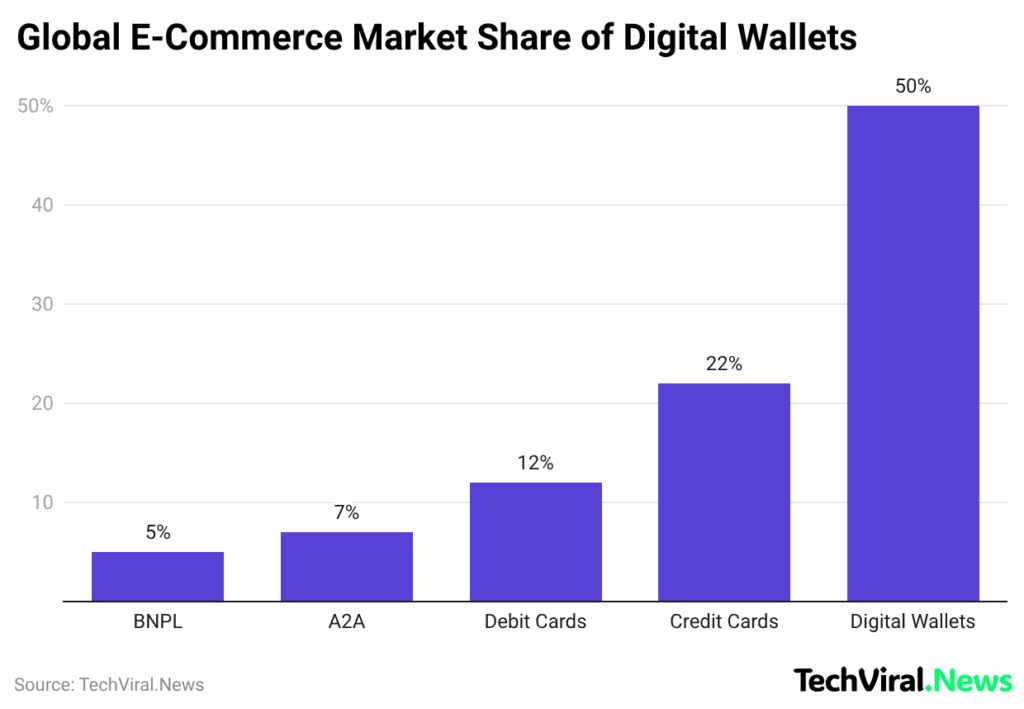
(Reference: oyelabs.com)
- The chart shows that digital wallets account for 50% of the global e-commerce payment market, followed by credit cards at 22% and debit cards at 12%.
- Other payment methods, such as A2A account transfers, account for 7%, while Buy Now Pay Later (BNPL) accounts account for 5%, making them the least used options.
By the Asia Pacific Countries
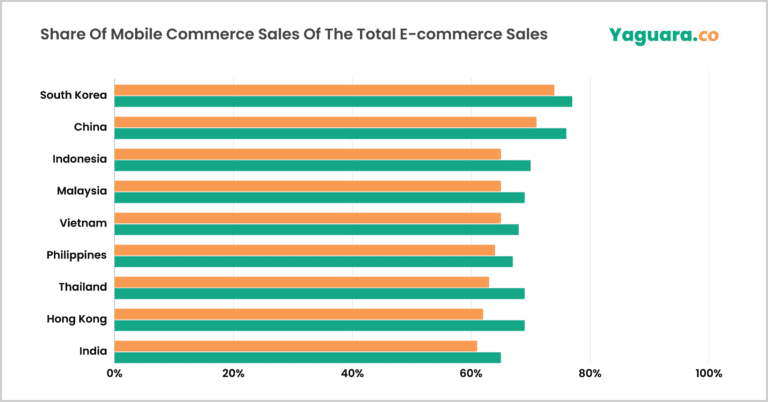
(Source: yaguara.co)
- South Korea is forecast to lead APAC mobile eCommerce in 2026, capturing the highest share at 77%, followed by China (76%) and Indonesia (70%).
- Other countries, such as Malaysia (69%), Hong Kong (69%), Vietnam (68%), the Philippines (67%), and India (65%), also show strong mobile eCommerce usage.
Mobile E-commerce Conversion
- Marketing LTB reports that desktop eCommerce conversion rates are 3.5%, whereas mobile conversion rates average 2.1%.
- With faster load times and improved user experience, the mobile conversion rate increases to 3.3%.
- Mobile sales rise by 31% with simplified checkout and 23% when forced account creation is removed.
- Additional gains include 18% from autofill, followed by product video (25%), larger CTAs (9%), trust badges (17%), and an increase in revenue through personalisation (19%).
Augmented Reality Becomes Essential In Mobile Shopping
- In 2025, approximately 60% of the U.S. population used augmented reality regularly.
- Around 90% of American shoppers already use AR or are willing to use it when making buying decisions.
- Products with AR features exhibit 94% higher conversion rates than non-AR users.
- Retailers achieved 40% reduction in returns and a 30% rise in sales through virtual try-on experiences.
Voice eCommerce Statistics
- Franetic report stated that more than 20% of mobile shopping searches are conducted via voice globally.
- 91% of voice queries originate from smartphones, indicating strong reliance on mobile worldwide.
- In 2025, nearly 45% of eCommerce interactions involved voice search.
- Meanwhile, 71% of users prefer voice commands for faster and easier product discovery.
- More than 60% of U.S. eCommerce shoppers purchase weekly using home voice assistants.
- Eight in ten voice buyers report overall satisfaction with mobile eCommerce.
Top Activities of Mobile Devices
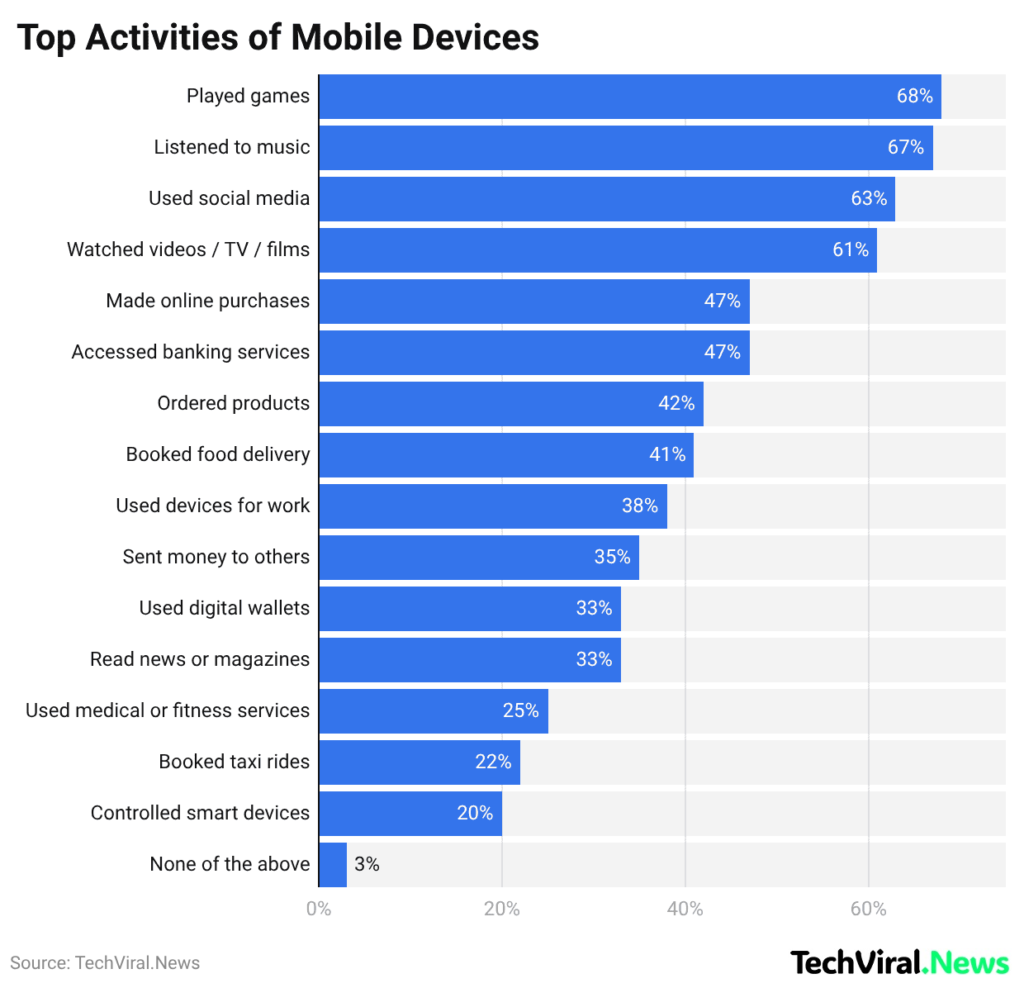
(Reference: buttercms.com)
- Most users play games (68%), listen to music (67%), use social media (63%), and watch videos or TV (61%), whereas 47% make online purchases or access banking services.
- Additionally, 42% order products, 41% book food delivery, 38% use devices for work, 35% send money, 33% use digital wallets or read news, 25% use fitness services, 22% book taxis, 20% control smart devices, and only 3% report none of these activities.
Mobile Commerce Adoption Statistics By Progressive Web Apps Accelerating
- According to The Retail Exec, approximately 70% of purchases now occur through mobile apps, with Progressive Web Apps (PWAs).
- PWAs load 63% faster, drive 50% higher conversion rates, generate 52% more mobile sessions, and reduce data usage by 80%.
- Performance results also show a 42.86% lower bounce rate and a 50% increase in customer engagement.
- In addition, businesses report that development costs can fall by up to 75% relative to native apps, making PWAs a cost-effective solution.
By Industry-Wise Share
- Marketing LTB observed that mobile commerce accounts for 72% of fashion sales, 78% of beauty and cosmetics sales, 54% of electronics sales, 83% of grocery delivery orders, and 95% of food delivery app orders.
- Mobile devices captured around 70% of travel bookings, followed by 8% (home décor purchases), 39% (luxury retail), 56% (sporting goods), and 60% (digital goods and subscription payments).
Livestream Shopping In Interactive Retail Statistics
- The global live commerce market was valued at USD 128.42 billion in 2024 and estimated to reach USD 2.47 trillion by 2033, with a 39.9% CAGR.
- Livestream events delivered up to 10 times higher conversion rates, with 30% conversion in U.S. commercial streams.
- The fashion segment accounted for 21.3% of adoption; those aged 25-34 accounted for 30% of sales (28% in China, 28% in the U.S.).
- Platform usage includes Facebook Live (55%), YouTube Live (52%), and Instagram Live (46%), TikTok Live, which is growing rapidly among Gen Z.
Mobile Web Cart Abandonment Statistics
- Uptain’s H1 2025 report (based on 30M users across 1,500+ shops) puts the overall cart abandonment rate at 71.72%.
- In the same period, cart abandoners spent a median of 4:20 per session (down from 4:55 in H2 2023).
- Dynamic Yield XP² benchmarks show 79.61% cart abandonment on mobile web, versus 67.29% on desktop.
- This means mobile-web abandonment is 12.32 percentage points higher (about 18.31% worse than desktop).
- IRP Commerce market data for December 2025 shows mobile drives 71.4% of ecommerce sales (desktop 27.3%, tablet 1.3%).
- The most-cited abandonment drivers in the XP² benchmarks are unexpected fees (55%), long/complicated checkout (21%), and trust concerns (17%).
- Uptain also finds that recovery offers work better when they are fixed-amount coupons (11.2% conversion) rather than percentage discounts (6.9% conversion).
Key Reasons Shoppers Prefer Mobile Commerce
- In 2026, the main reason people choose mobile shopping is that about 73% of consumers prefer buying on their phones because it’s easy and accessible throughout the day.
- Mobile users often start their purchase journey on smartphones: 49% use their devices to compare prices, and 46% research product ratings and reviews before buying.
- Social media also plays a major role, as nearly 40% of mobile purchases are made directly on social platforms.
- 65% of consumers report buying products based on influencer recommendations.
Smartphone Usage Patterns Of North Americans During In-Store Shopping
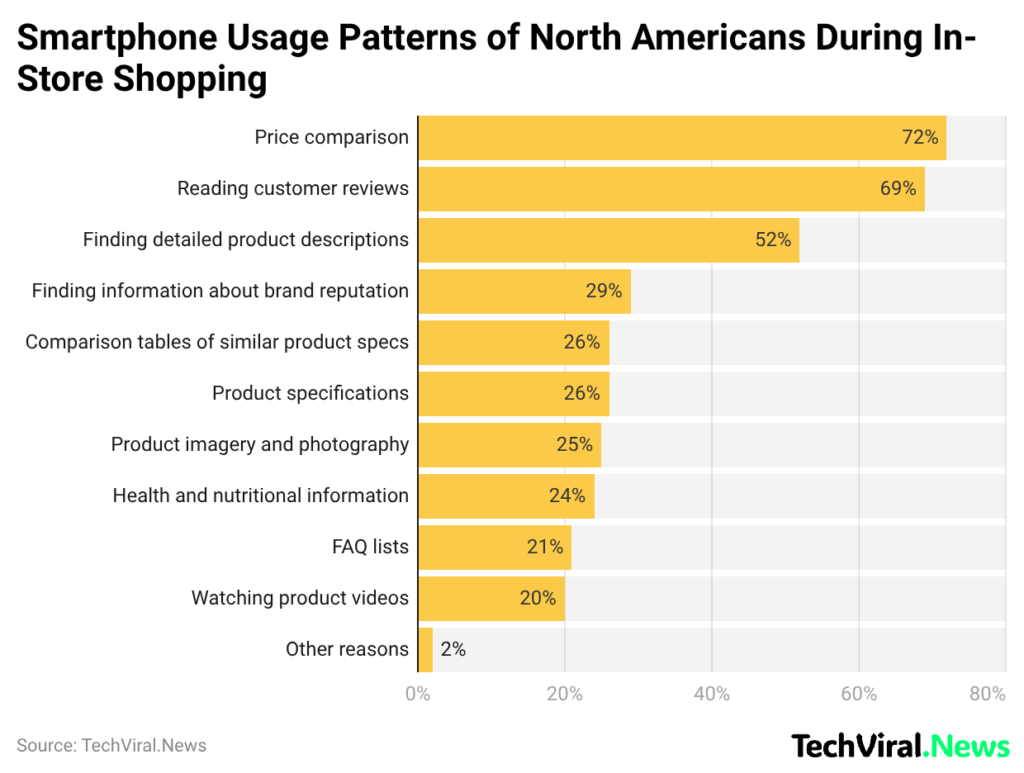
(Reference: sellerscommerce.com)
- In 2025, around 72% of North American shoppers primarily used smartphones to compare prices.
- Other uses reading customer reviews (69%), finding detailed product descriptions (52%), finding information about brand reputation (29%), and using comparison tables detailing the specifications of similar products (26%).include viewing product specifications (25%), product imagery (24%), FAQs (21%), watching product videos (20%), and other reasons (2%).
Top Problems of Mobile Shopping
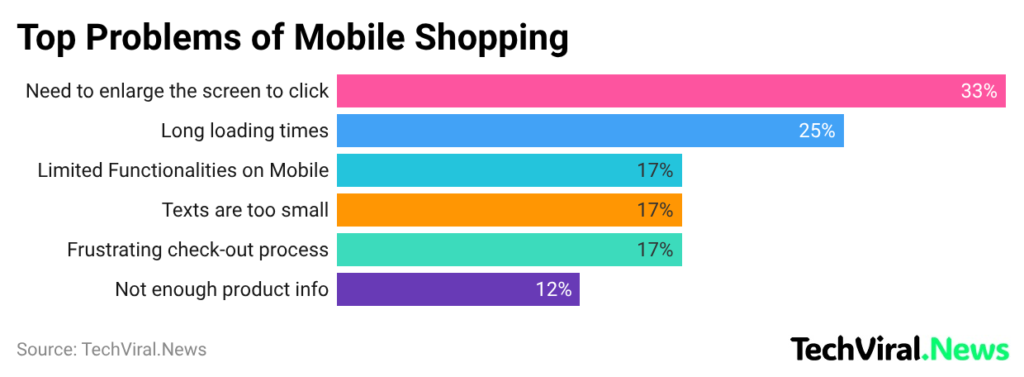
(Source: pagetraffic.com)
- Around 33% of mobile shoppers report difficulty clicking due to small screens, while 25% are frustrated by slow loading times.
- In addition, 17% cite limited features, small text, or a poor checkout experience, and 12% struggle because of insufficient product information.
Future Trends Shaping Mobile Commerce
- Mobile commerce is advancing rapidly as new technologies enhance user experience and convenience.
- With 5G, increasing mobile page speed by 75% will make smartphone shopping faster and smoother.
- Mobile AR try-on usage is projected to increase by a factor of 4 by 2027, while voice commerce is forecast to reach USD 45 billion by 2026.
- AI-driven product recommendations already account for 25% of mobile revenue, while chat-based shopping will grow by 30% from last year.
- Mobile wallet usage could reach 92% by 2030.
- Unified cross-device checkout is expected to reduce cart abandonment by 38%, with PWA shopping expected to triple.
- Social commerce is set to overtake mobile web shopping by 2029, and personalised experiences will define brand loyalty by 2030.
Conclusion
To conclude, mobile eCommerce plays a major role in today’s online shopping landscape by changing how customers interact with brands and purchase products. It offers quick, easy, and personalised shopping experiences that improve customer satisfaction and help businesses grow. As mobile technology continues to improve, companies that focus on mobile shopping will remain competitive. Mobile eCommerce is no longer just an option; it is shaping the future of retail.
FAQ
Traditional eCommerce suits desktops; mobile eCommerce focuses on touchscreens, fast checkout, UPI/wallet payments, and variable network conditions.
Mobile websites boost reach, SEO, sharing, and simpler upkeep; apps drive loyalty, personalisation, push alerts, repeat buys; PWAs blend both, no stores.
Mobile conversion rate
Add-to-cart rate
Checkout completion rate
Page load time / Core Web Vitals
Cart abandonment rate
Revenue per visitor (RPV)
CAC and LTV by device
Funnel drop-off by step
Cards + saved cards
Wallets (Apple Pay, Google Pay, Paytm/PhonePe, etc.)
UPI (India)
Buy Now Pay Later (BNPL)
Cash on Delivery (where common)
See recently viewed and recommended items, reorder home/categories by behaviour, estimate delivery based on location and stock, and offer relevant deals without over-personalising.