
Introduction
Card Not Present Fraud And Chargeback Statistics: By the year 2025, worldwide digital payments will have reached their peak, and the markets will have become totally interlinked: online shopping, mobile wallets, subscription services, and real-time payments will have completely removed the barriers to buying and selling. Nevertheless, along with this comfort, there is a clear-cut truth: the criminals now focus on the transactions where the card is not present—the case might be either online shopping, app purchases, or mobile checkouts.
The crime referred to as Card-Not-Present (CNP) fraud, which is the same as this kind of fraud, has now become a global problem that costs businesses, banks, and consumers billions of dollars every year. In this write-up, we will analyze the most recent data from 2025 that concerns Card Not Present Fraud and Chargeback statistics, their causes, trends, and industry impacts, and we will also give suggestions on how to alleviate losses.
Editor’s Choice
- The number of global chargebacks is forecast to grow from 261 million in 2025 to 324 million by 2028, indicating a steady increase of 10 or more per year driven by the growth of digital payments.
- The total amount of money that will be charged back globally is also expected to increase significantly—it is estimated to rise from US$33.79 billion in 2025 to US$41.69 billion in 2028, representing a 23% surge over just three years.
- The rate of chargebacks for e-commerce and online retail increased by 222%, to around 10 million disputes per year, and the main factors behind the increase are friendly fraud and non-delivery claims.
- CNP fraud is now 81% more likely than in-store fraud and has thus emerged as the most common form of payment fraud worldwide.
- By 2028, it is anticipated that North America will have a regional chargeback value of US$20.47 billion, Europe will have US$3.17 billion, Asia-Pacific will have US$5.98 billion, the Middle East and Africa will have US$3.59 billion, while Latin America will have US$8.49 billion.
- The Middle East and Africa will be the region with the highest increase, i.e. 59%, whereas Asia-Pacific and Europe will come next with 35% and 27% increases, respectively.
- Chargeback rates in the digital goods and subscription services category rose by 59%, and almost 70% of disputes are attributed to friendly fraud.
- In the U.S. market, card-not-present fraud losses jumped from US$5.04 billion in 2019 to US$10.16 billion in 2024, accounting for 74% of total card payment fraud.
- Disputes are mainly driven by billing errors, unclear descriptors, and hard-to-cancel subscriptions; 80% of consumers believe clearer descriptors could eliminate confusion.
- Third-party eCommerce fraud is expected to rise by 141% between 2024 and 2029, reaching a whopping US$107 billion.
- Along with the chargebacks, U.S. merchants are responsible for about 10% of the global total, and it is predicted that the volumes will reach 146 million transactions worth US$15.3 billion by 2026.
Worldwide Chargeback Volume
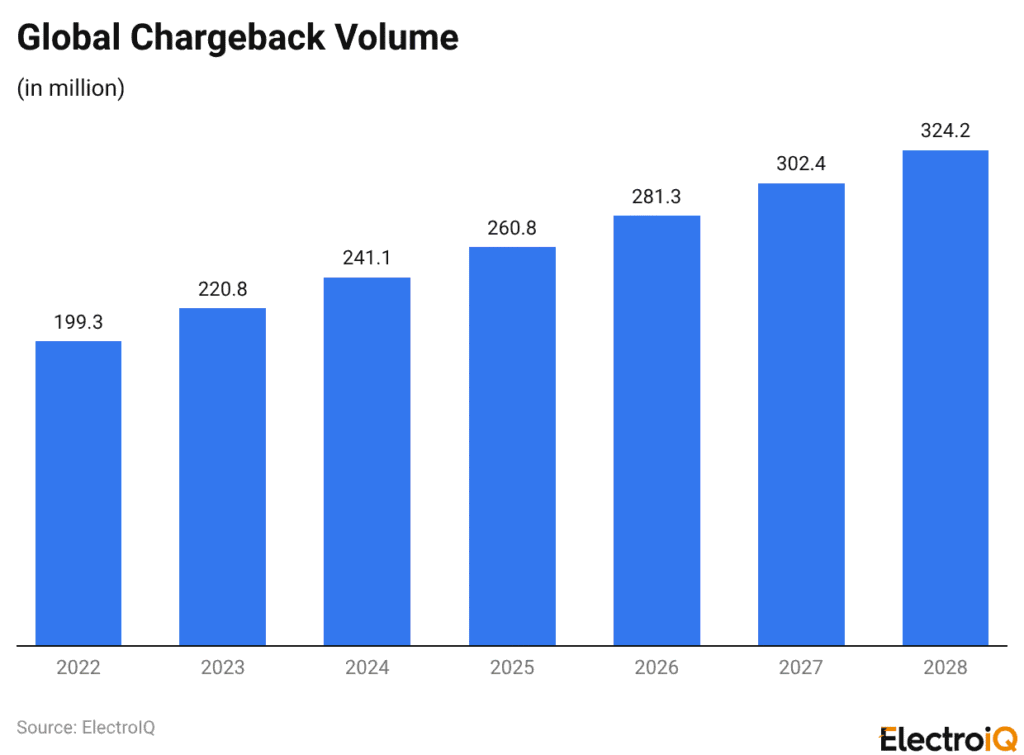
(Reference: chargeflow.io)
- Global chargebacks are expected to soar rapidly in the coming years, indicating increasing payment disputes and fraud worldwide.
- Chargeback volume is anticipated to reach 324 million transactions by 2028, a substantial double-digit increase from the 261 million forecast for 2025. The concern of merchants continues to grow as the number of digital transactions increases.
- The total amount of chargebacks worldwide is likely to increase from US$33.79 billion in 2025 to US$41.69 billion in 2028, which is a 23% growth over three years. This rise is a clear indication that chargebacks are turning out to be a costly challenge for businesses.
- U.S. merchants are carrying the bulk of this load. Though smaller in number compared to global commerce, they are still responsible for about 10% of the worldwide chargeback volume.
- Chargebacks in the U.S. are estimated to be 146 million transactions by 2026, worth around US$15.3 billion, thus highlighting the financial risk American companies need to take.
The Rise of Card-Not-Present Fraud In The Digital Payments Era
- The switch from magnetic stripe to EMV “chip” credit cards has led to an 80% decrease in card-present fraud, greatly enhancing the security of in-store transactions.
- On the other hand, as physical payments became less susceptible to fraud, the latter turned to online purchases, which were the weakest link.
- Nowadays, the likelihood of card-not-present fraud is 81% higher than that of in-store fraud.
- Criminals are quick to change their methods and choose the channel that gives them the highest return.
- Consequently, the online sale has become the most popular medium for carrying out fraud.
- This tendency is strengthened by the decrease in the price of stolen payment information, particularly the credit card data, which has grown by a whopping 153% on the dark web in parallel with the rising frequency and severity of data breaches.
- The impact on finances is indeed drastic, as the retail industry is facing a staggering loss of about US$130 billion due to fraudulent card-not-present transactions.
- Not only the direct revenue loss and chargebacks negative aspects, but also the consumer mistrust—over half of the customers will change their shopping habits after facing fraud, which may include switching to another retailer, closing their accounts, or shopping less online.
Chargeback Statistics By Industry
| Industry | Chargeback Trend Overview | Average Chargeback Value & True Cost |
| Travel and Hospitality | The sector experienced an unbelievable increase in chargebacks, with rates rising 816% from 0.1% in 2023 to 0.916% in 2024. The main reason for the spike was disputes over cancellations and non-delivery claims (Visa Reason Code 13.3). Around 5 million chargebacks went through the system in this time frame. | The average disputed transaction is US$84, but total costs reach about US$315 per chargeback when other fees and losses are included. |
| eCommerce and Online Retail | Chargeback rates increased by more than 100%, with a huge surge of 222% from 0.15% in Q1 2023 to 0.47% in Q1 2024. Disputes of about 10 million take place every year, with the main reason being friendly fraud (75%) and non-delivery claims (Code 13.2). The mid-sized merchants are the ones who are most hit, having to deal with rates of 0.6% to 1% while large companies only have to pay 0.4%. | Chargeback rates increased by more than 100%, with a huge surge of 222% from 0.15% in Q1 2023 to 0.47% in Q1 2024. Disputes of about 10 million occur each year, with the main reasons being friendly fraud (75%) and non-delivery claims (Code 13.2). The mid-sized merchants are the ones who are most hit, having to deal with rates of 0.6% to 1% while large companies only have to pay 0.4%. |
| Digital Goods and Subscription Services | Chargeback activity rose by 59%, increasing from 0.34% in 2023 to 0.54% in 2024. This growth is largely attributed to unauthorized transactions (Code 10.4) and friendly fraud, which accounts for nearly 70% of disputes. The sector recorded around 3 million chargebacks. | Average dispute values vary by category: US$77 for digital goods, US$99 for high-risk segments such as gaming, gambling, and crypto, and US$69 for subscription services. Total merchant costs range from US$288 to US$371 per dispute after accounting for indirect losses. |
Why eCommerce Chargebacks Are Rising Rapidly
- The global market for credit card payment transactions is anticipated to surpass US$79 trillion in the year 2030, but at the same time, fraud-related losses are increasing at the same rate.
- The amount of money businesses are expected to lose to payment fraud by 2030 is estimated at around US$49.32 billion, with third-party eCommerce fraud predicted to grow 141% from US$44.3 billion in 2024 to US$107 billion by 2029.
- The total share of online buying and selling remains the safest transaction type, as digital transactions are growing much faster than physical ones.
- Of all transactions, card-not-present (CNP) transactions account for 63% of total merchant volume, and they carry a higher chargeback risk than in-store sales.
- CNP transaction chargeback rates usually range from 0.6% to 1%, whereas the card-present payment chargeback rate is only 0.5%.
- The United States has seen the CNP fraud losses rise steeply from US$5.04 billion in 2019 to US$10.16 billion in 2024, with the latter accounting for 74% of total card payment fraud.
- To counteract this risk, e-commerce sellers are said to invest approximately 10% of their annual revenue in fraud prevention.
- While some security technologies are doing some good, it is said that tokenization is causing the disappearance of 15% of unauthorized CNP chargebacks, and biometric authentication is also making the rate of fraud go down by 20%.
- Merchants and their issues are seen as the main factor behind the rise in payment and refund disputes.
- Transaction errors, communication issues, and subscription cancellations are among the instances that lead customers to the bank’s door rather than to the merchants.
- Last year, as many as 50% of consumers had looked into a particular transaction shown on their statements, of which 24% had done so simply because they did not recognize the purchase.
- Almost all of those consumers had contacted their bank for clarification, and more than 35% who needed assistance requested a refund directly through their card issuer, thereby escalating the issue.
- The management of subscriptions is still a tough nut to crack, as around one-third of cardholders admit that the cancellation process is far from easy.
- Along with brightening up the billing, disputes could be minimized greatly with the help of 80% of consumers who will assure that improved merchant descriptors are a sure-fire way to keep them from getting confused.
- The non-delivery dispute rate has been reduced by 25% through making transparency a policy with comprehensive order tracking and accurate billing labels.
- 72% of eCommerce merchants in 2024 reported an increase in friendly fraud, which is now considered a major source of fraud losses, accounting for 40% to 80%.
- The most common reasons are: buyer’s remorse at 65.3%, deliberate abuse of the chargeback system at 60.9%, and plain misunderstandings at 38.6%.
- Social influence is growing, with 27% of offenders citing social media as a factor, and 42% of Gen Z respondents admitting they have wrongfully filed chargebacks.
- The behavior of the chargeback filers is such that 40-50% of the friendly fraudsters will file another dispute within a period of 60 days.
- One can clearly see the difference between the behavior of the younger demographics, Gen Z being the main contributor to 60% of the chargebacks due to regret over impulse purchases, while millennials are 30% more likely to dispute recurring subscription charges.
- The first-party fraud type of chargebacks accounts for 13% of the disputes at financial institutions and 21% at merchants, while third-party fraud disputes account for 59% at financial institutions and 24% at merchants.
- The non-fraud cases, such as service or fulfilment issues, account for 28% of financial institutions and 38% of merchants, indicating that both operational and customer areas remain the main drivers of chargebacks in e-commerce.
Regional Chargeback Trends
- The global trend of chargeback values is expected to take a substantial rise by 2025–2028; however, the regional differences in the patterns of growth will be due to the differences in e-commerce development, fraud exposure, consumer behavior, and regulatory frameworks.
- Merely 25% of merchants in the world process over one million chargebacks each year, whereas 13% of them have chargeback rates of 2% or even higher—this percentage even reaches 20% in the case of Australian merchants.
- The North American market is projected to reach a chargeback value of US$20.47 billion by the end of 2028, an increase of 16%, mainly attributable to organised fraud targeting high volumes of card-not-present transactions.
- The chargebacks in Europe will amount to US$3.17 billion, a 27% increase, with friendly fraud remaining a major issue even after the strict PSD2 authentication requirements came into effect.
- The Asia-Pacific region is estimated to see US$5.98 billion in chargebacks, a 35% increase, as rapid eCommerce growth continues to create new avenues for fraud.
- The Middle East and Africa, with a combined US$3.59 billion in chargebacks—a 59% increase—has been driven by the region-wide digital transformation and increased cross-border fraud activity.
- The Latin American chargebacks value came in at US$8.49 billion, a 22% increase, owing to the fact that online retail adoption is now faster than the deployment of sophisticated fraud prevention tools.
- In Asia, India is the fastest-growing market and has even reported a 45% rise in chargeback volumes in 2024, driven by the rapidly expanding e-Commerce sector and increased use of digital payments.
- Across all regions, cross-border transactions—accounting for roughly 20% of global eCommerce—continue to face chargeback rates nearly twice those of domestic transactions, primarily due to currency-related disputes, longer delivery times, and fulfilment challenges.
Conclusion
Card Not Present Fraud and Chargeback Statistics: By 2025, card-not-present fraud, along with chargebacks, will have become one of the most critical challenges not only for the digital payments ecosystem but also for the global one. It is fraudsters who have taken advantage of the weaknesses in security, customer behavior, and merchant operations, as online and cross-border transactions are the dominating forms of commerce.
The demand for robust prevention strategies is evident in rising chargebacks, increasing friendly fraud, and escalating financial losses. The merchants need to offer seamless customer experiences while also investing in strong fraud controls, transparent billing, and proactive dispute management.
Companies that rely on authentication, data protection, and customer education as a one-time investment only will see that chargebacks will continue to take a toll on their revenue, trust, and long-term profitability across industries worldwide, and within their different parts.
When a transaction is made without the physical card, like in online, mobile, or in-app purchases, it is called card-not-present fraud. The reason why it is increasing is that fraudsters have shifted away from in-store payments after EMV chip cards have reduced card-present fraud by about 80%. Moreover, the rapid growth in e-commerce, mobile payments, and access to stolen card data on the dark web has further sped up CNP fraud.
The global chargeback volume is anticipated to grow from 261 million transactions in 2025 to 324 million by 2028. In tandem with this growth, the total value of chargebacks is expected to rise from US$33.79 billion to US$41.69 billion during the same timeframe, making the financial burden on merchants worldwide even bigger and more critical.
The travel and hospitality, eCommerce, and online retail sectors, as well as digital goods and subscription services, are the most affected ones. The travel and hospitality industry experienced an enormous increase of over 800% in chargeback rates, while eCommerce disputes amounted to more than 10 million a year, and digital subscriptions were also involved in rising disputes that were mainly blamed on friendly fraud and unauthorized transactions.
Friendly fraud or first-party fraud now takes up 40% to 80% of the total fraud losses. It is usually the result of buyer’s remorse, misunderstanding of billing descriptors, subscription cancellations, or intentional abuse of the chargeback process. The younger generation, particularly Gen Z and Millennials, is more likely to commit friendly fraud.
It is predicted that the Middle East and Africa will experience the highest chargeback growth rates of 59% by the year 2028, followed by Asia-Pacific with 35% and Europe with 27%. North America will still have the largest amount in terms of chargeback value, which is projected to be US$20.47 billion.