

Introduction
Banking Fraud, Scams, and Cybercrime Statistics: In recent years, banking fraud, scams, and cybercrime have become a serious threat to our daily lives. In today’s busy routine, billions of people use mobile banking, cards, and online payments, and the associated risks are also increasing.
Earlier, online fraudsters often relied on cash, cards, or direct bank access. Today, they can steal money through phishing links, scanners, fake messages, cloned websites, OTP, or by taking control of a phone number (SIM). Common tricks include phishing emails, false “KYC update” alerts, identity theft, account takeover, card skimming, and attacks that lock bank systems for ransom. Such crimes affect both customers and banks: customers may lose savings and feel stressed, while banks incur additional costs and lose trust.
This article on Banking Fraud, Scams, and Cybercrime Statistics includes several current analyses and insights that explain the major types of scams, how attackers operate, and simple steps to stay safe.
Editor’s Choice
- By 2025, the global cost of cybercrime is projected to reach approximately USD 10.29 trillion, representing an 11.61% increase over the previous year.
- According to Soax.com’s analyses, investment fraud accounted for the largest losses at USD 4,570.27 million, followed by business email compromise (USD 2,946.83 million) and tech support scams (USD 924.51 million).
- Meanwhile, the payment fraud rate rose to 80% in 2023 and then fell slightly to 79% in 2024.
- Globally, approximately 65% of financial organisations were hit by ransomware attacks.
- As of 2024, approximately 64% of Americans reported credit card fraud as the most common issue, followed by data breaches (32%) and account hacking (31%).
- In cyber fraud campaigns, financial brands were most often targeted (39.5%), followed by retail (21.4%) and technology (12.5%).
- Among people aged 60 years and above, there were 101,068 complaints and total losses of USD 3,400 million.
- Phishing and spoofing dominate cybercrime, with APWG reporting 1,003.94 attacks in the first quarter of 2025.
- A BioCatch report, based on data from financial institutions serving nearly 350 million consumers across five continents, found scam attempts rose 65% in the past year.
- By 13 August 2025, estimates indicated that the digital payment fraud market had reached approximately USD 50 billion by the end of 2024.
- From April 14 to 24, 2025, approximately 73% of U.S. adults experienced at least one online scam or attack.
- In the United States, approximately 30% of Americans experienced an online scam in 2025.
- In 2025, credit card fraud is expected to account for approximately 38% of FTC identity-theft complaints, with 323,000 cases reported in the first half of the year.
- 57% of global banks lost more than USD 500,000 to direct fraud, and more than 25% reported losses exceeding USD 1 million.
General Cyber Crime Statistics
- According to brightdefense.com, cybercrime costs are projected to reach approximately USD 10.5 trillion per year by 2025, with annual growth of approximately 15%.
- The WEF projects that it will rank as the world’s 3rd-largest economy; by 2027, it may reach USD 23 trillion, 175% higher than in 2022.
- Meanwhile, the average breach cost decreased from USD 4.88 million (2024) to approximately USD 4.4 million (2025), a 9% decrease.
- Ransom payments increased by 500%, resulting in USD 2 million, and non-recoveries averaged USD 2.73 million.
- Ransomware damages are projected to reach approximately USD 275 billion per year by 2031, and cyber-insurance premiums may reach approximately USD 29 billion by 2027.
- Claims fell 4% for firms under USD 25 million in revenue (approximately 73K each) but rose 23% for USD 25 million to USD 100 million firms (USD 129K).
- Global security spending is forecast at USD 212 billion by 2025, with the cybersecurity market projected at USD 424.97 billion by 2030 (13.8% CAGR) and cryptojacking solutions at USD 64.87 billion by 2033.
- Many SMBs allocate 5%-20% of their IT budgets and spend about USD 2,700 per employee; phishing penalties rose by 144%.
- Meanwhile, the tech sector was targeted for the 7th consecutive year.
- Verizon also reports that median ransom demands equal 1.34% of revenue (for 80% of cases, 0.13%-8.30%).
- Only 4% of complaints involve direct financial loss, and 62% of money-driven breaches involve extortion.
(Source: thesslstore.com)
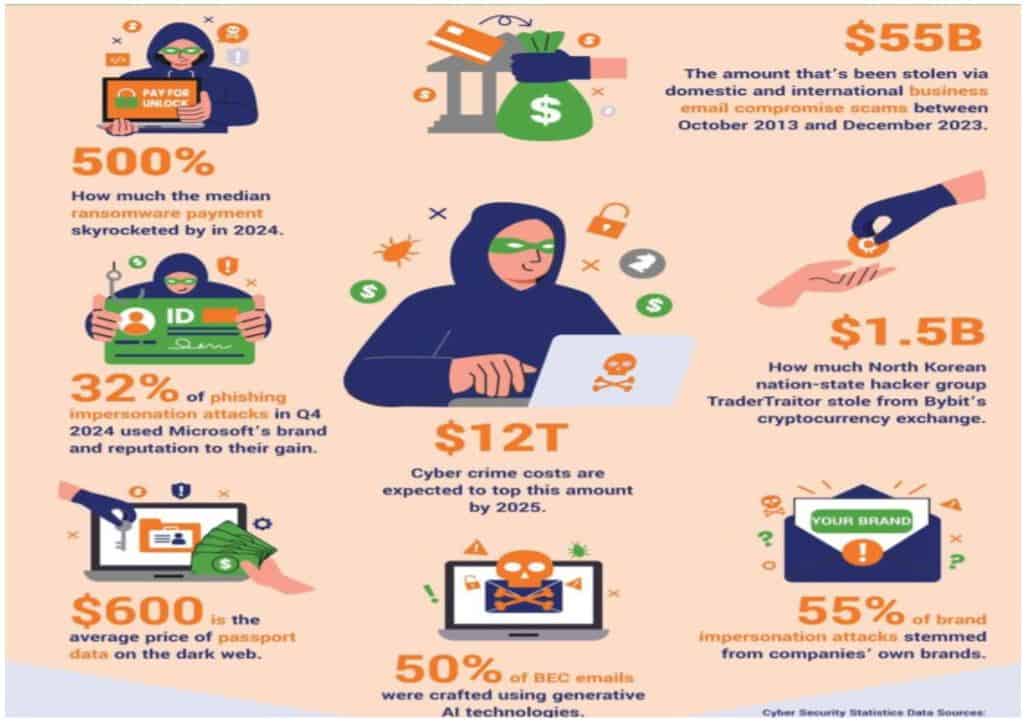
- The infographic reported that the median ransomware payment had skyrocketed by 500% in 2024.
- Approximately USD 55 billion was stolen through business email compromise scams, both domestic and international, between October 2013 and December 2023.
- Meanwhile, 32% of phishing impersonation attacks in Q4 2024 had leveraged Microsoft’s brand and reputation.
- Cybercrime costs were expected to exceed USD 12 trillion by 2025.
- The North Korean state-linked hacker group TraderTraitor had stolen USD 1.5 billion from Bybit’s cryptocurrency exchange.
- Moreover, passport data averaged USD 600 on the dark web, and 50% of BEC emails were crafted using generative AI.
- 55% of brand impersonation attacks originated from companies’ own brands.
Global Banking Sector Statistics by Rising Fraud, Scams, and Cybercrime Losses
| Region / Institution | Fraud / Cybercrime Indicator | Numeric Information |
| India (Banking Sector) | Total banking fraud losses (2024–2025) | ₹36,014 crore |
| Year-on-year increase in losses | 194% | |
| Approximate number of reported cases | 24,000 cases | |
| India (Public Sector Banks) | Share of total fraud losses | ₹25,667 crore |
| Share of total losses | 71% | |
| State Bank of India (SBI) Jan 1, 2024-Oct 31, 2025 | Cyber fraud incidents reported | 15,956 cases |
| Losses from cyber fraud | ₹118.47 crore | |
| India (Other Financial Frauds) | Other financial fraud cases | 5,105 cases |
| Losses from other financial frauds | ₹477.64 crore | |
| Online banking fraud incidents | 6,630 cases | |
| Losses from online banking fraud | ₹62.37 crore | |
| United Kingdom | Total payment fraud losses (2024) | £1.17 billion |
| Number of payment fraud cases | 3.13 million cases | |
| Increase compared to 2023 | 14% | |
| Remote purchase fraud increases | 22% | |
| Remote purchase fraud cases | 2.6 million cases | |
| Global Banking Sector | Banks with losses over USD 500,000 | 57% |
| Banks with losses over USD 1 million | >25% |
Types Of Banking Fraud Statistics
- According to coinlaw.io, banking fraud shows that phishing scams affected 52% of victims, whereas card-not-present fraud accounted for 63% of card-related losses.
- Malware and spyware attacks rose by 22%, and account takeover fraud increased by 19%.
- Unauthorised wire transfers and cryptocurrency wallet scams led to USD 2 billion and USD 3 billion in losses, respectively.
- Lastly, check fraud made up 7% of reported cases.
Cybercrime Type Causing The Greatest Harm
- According to Soax.com’s analyses, Investment fraud represented the primary driver of financial harm, resulting in total losses of USD 4,570.27 million.
- Business email compromise ranked second most damaging, accounting for USD 2,946.83 million in damages.
- Tech support scams caused a significant financial impact, with total losses reaching USD 924.51 million.
- Personal data breaches led to USD 744.21 million in losses, while confidence and romance fraud cost victims USD 652.54 million.
- General data breaches accounted for USD 534.39 million, followed by government impersonation scams at USD 394.06 million.
- Non-payment or non-delivery schemes resulted in USD 309.64 million in losses, and credit card or check fraud accounted for USD 173.62 million.
- Real estate fraud caused USD 145.24 million in damages, slightly exceeding the USD 134.51 million caused by advanced fee scams.
- Identity theft losses totalled USD 126.20 million, followed by lottery, sweepstakes, and inheritance scams, which totalled USD 94.50 million.
- Extortion schemes cost victims USD 74.82 million, while employment-related scams resulted in USD 70.23 million in losses.
- Ransomware attacks resulted in USD 59.64 million in reported damages, and SIM swap fraud totalled USD 48.79 million.
- Overpayment scams and botnet activities accounted for USD 27.95 million and USD 22.42 million, respectively.
- Phishing and spoofing incidents caused USD 18.72 million in losses, followed by threats of violence, which caused USD 13.53 million in losses.
- Harassment or stalking resulted in USD 9.67 million in damages, and intellectual property rights or counterfeit crimes resulted in USD 7.55 million in damages.
- Crimes against children accounted for USD 2.03 million in losses, while malware-related incidents accounted for USD 1.21 million.
- Miscellaneous cybercrime categories accounted for an additional USD 240.05 million of the total financial impact.
Cost Of Cybercrime Statistics
(Reference: soax.com)
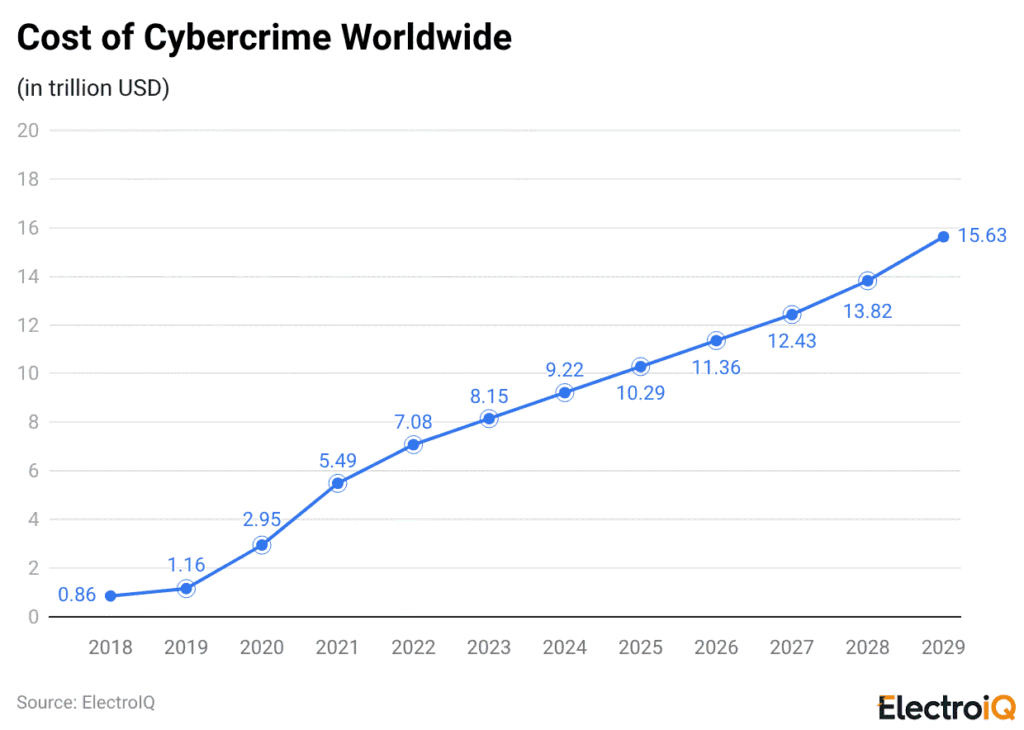
- As of 2024, the cost of cybercrime was USD 9.22 trillion, with a 13% increase from last year, resulting in USD 8.15 trillion (in 2023).
- By 2025, the cost is projected to reach approximately USD 10.29 trillion, up 11.61% from last year.
- Followed by 2026: USD 11.36 trillion (+10.4%), 2027: USD 12.43 trillion (+9.42%), 2028: USD 13.82 trillion (+11.18%), and 2029: USD 15.63 trillion (+13.1%).
Organisations Experiencing Attempted And/Or Actual Payments Fraud Analyses
(Source: usbank.com)
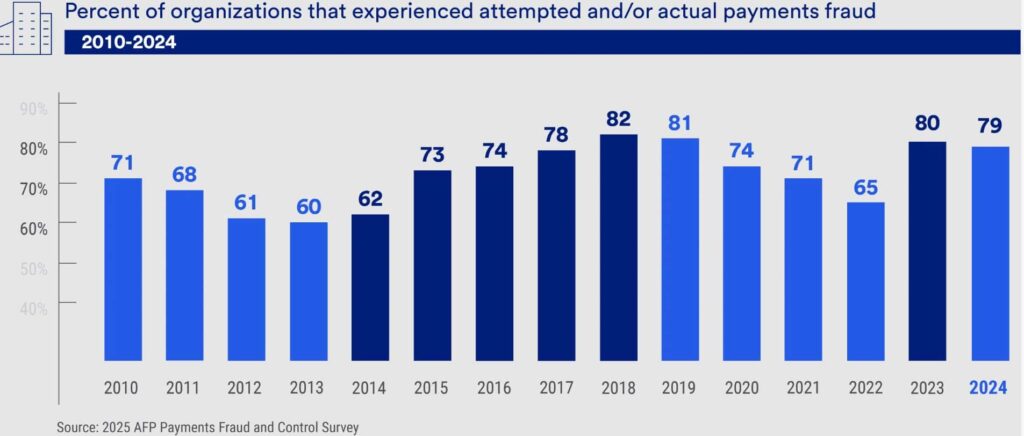
- Overall, the payment fraud rate reached 82% in 2018, followed by 81% in 2019, 74% in 2020, 71% in 2021, and 65% in 2022.
- Meanwhile, the rate rose to 80% in 2023 and then fell slightly to 79% in 2024.
Financial Organisations Affected By Ransomware Attacks
(Reference: cybelangel.com)
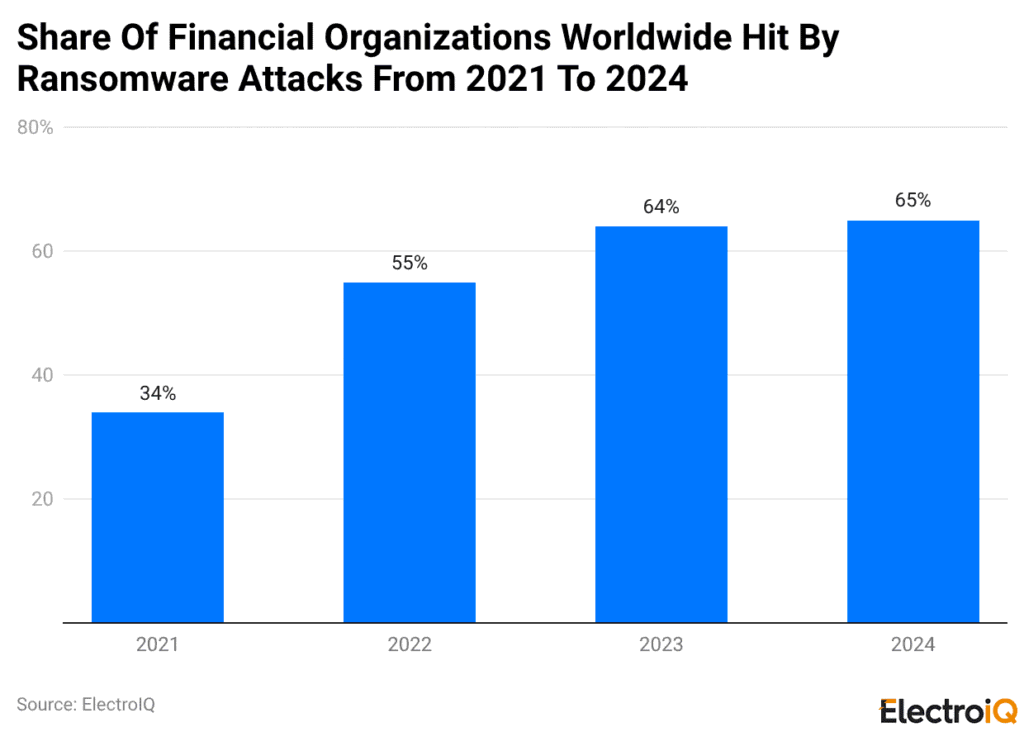
- Globally, approximately 65% of financial organisations were hit by ransomware attacks, up from 64% in 2023.
- Financial organisations further claimed that ransomware attacks rose from 34% in 2021 to 55% in 2022.
U.S. Financial Cyberattack Data Violations
(Reference: statista.com)
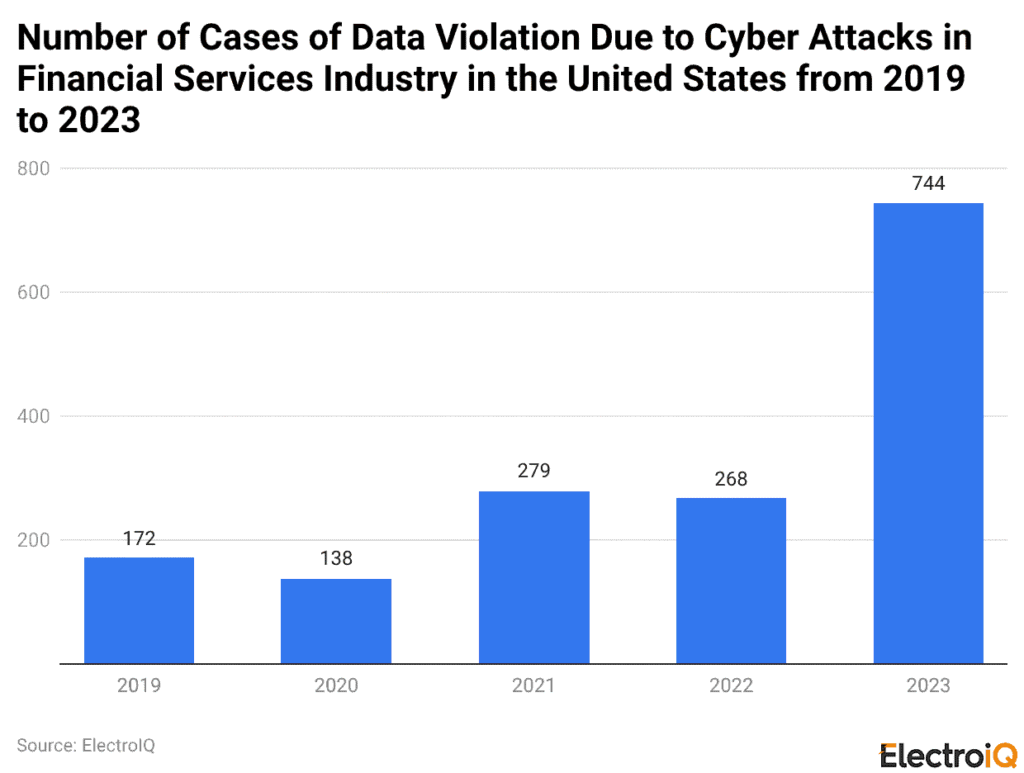
- In the United States, the number of data-breach cases in the financial services industry due to cyberattacks totalled 744 in 2023.
- The total number of data violation cases remained at 268 in 2022, followed by 279 (2021), 138 (2020), and 172 (2019).
Financial Cybercrime Types In The U.S.
(Reference: statista.com)
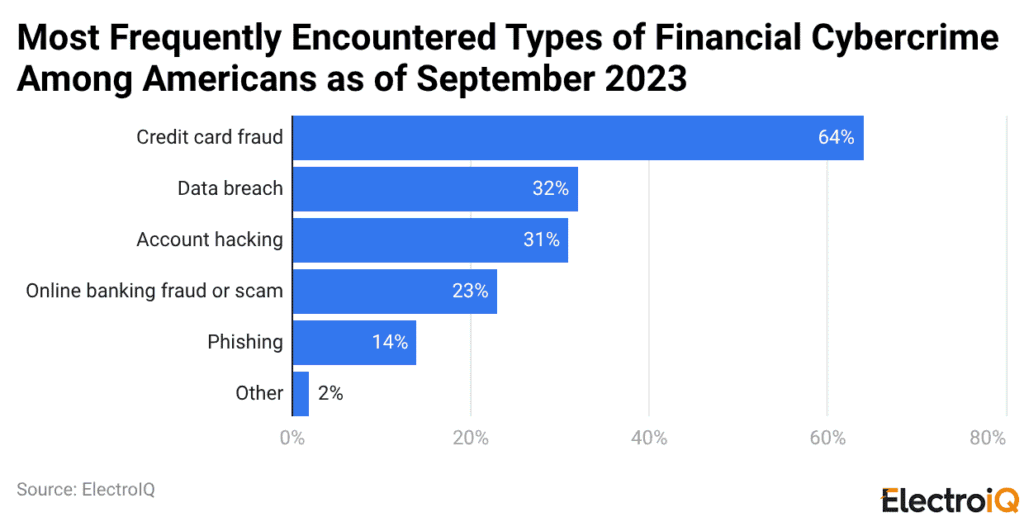
- As of 2024, approximately 64% of Americans reported credit card fraud as the most common issue, followed by data breaches (32%) and account hacking (31%).
- About 23% reported online banking scams, 14% reported phishing attempts, and only 2% mentioned other types of financial cybercrime.
Indian Industries Most Abused In Cyber Fraud Campaigns
(Source: the420.in)
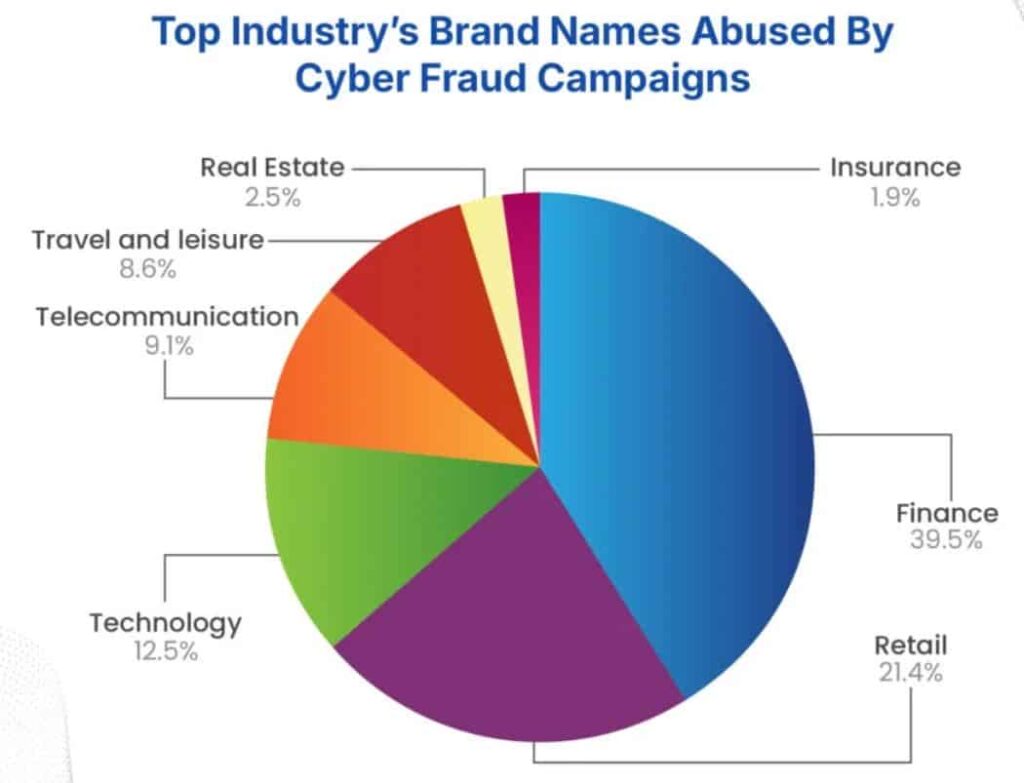
- In cyber fraud campaigns, financial brands were most often targeted (39.5%), followed by retail (21.4%) and technology (12.5%).
- Moreover, smaller shares came from telecommunication (9.1%) and travel and leisure (8.6%).
- Abuse was less common in real estate (2.5%) and insurance (1.9%).
Cybercrime Money Lost Statistics By Age Group
(Source: soax.com)
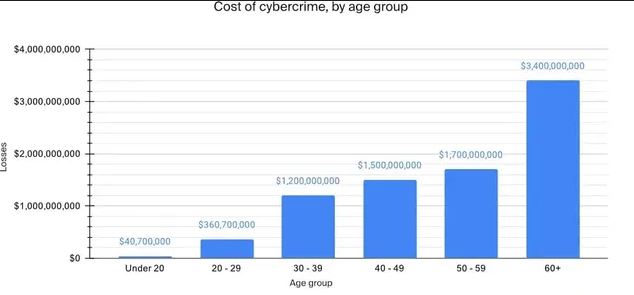
- Among people aged 60 years and above, there were 101,068 complaints and total losses of USD 3,400 million.
- Meanwhile, the average loss per complaint accounted for USD 33,640.72.
Furthermore, other demographic analyses are stated in the table below:
| Age Group (Year) | Complaints | Losses (USD) | Losses (USD Million) | Avg Loss per Complaint (USD) |
| 50-59 | 65,924 | 1,700,000,000 | 1,700 | 25,787.27 |
| 40-49 | 84,052 | 1,500,000,000 | 1,500 | 17,846.10 |
| 30-39 | 88,138 | 1,200,000,000 | 1,200 | 13,615.01 |
| 20-29 | 62,410 | 360,700,000 | 360.7 | 5,779.52 |
| Below 20 | 18,174 | 40,700,000 | 40.7 | 2,239.46 |
Cybercrime Costs Analyses By State & Territory
| State/Territory | Total cost (USD) | Complaints | Avg cost/complaint (USD) | Highest-cost loss (USD) |
| Alabama | 96,349,731 | 5,295 | 18,196.36 | 32,036,807 |
| Alaska | 31,755,398 | 2,189 | 14,506.81 | 12,236,756 |
| American Samoa | 327,466 | 31 | 10,563.42 | 271,000 |
| Arizona | 324,013,861 | 15,344 | 21,116.65 | 94,143,904 |
| Arkansas | 46,562,887 | 2,892 | 16,100.58 | 15,284,456 |
| California | 2,156,755,382 | 72,102 | 29,912.56 | 983,814,706 |
| Colorado | 187,401,125 | 10,379 | 18,055.80 | 60,844,895 |
| Connecticut | 120,763,026 | 4,400 | 27,446.14 | 38,103,346 |
| Delaware | 35,376,771 | 2,561 | 13,814.00 | 9,618,579 |
| District of Columbia | 46,135,047 | 3,529 | 13,073.12 | 18,970,376 |
| Florida | 873,833,671 | 37,922 | 23,042.92 | 311,140,271 |
| Georgia | 300,547,570 | 12,725 | 23,618.67 | 105,755,535 |
| Guam | 747,877 | 81 | 9,233.05 | 381,750 |
| Hawaii | 51,433,400 | 1,686 | 30,506.17 | 34,480,031 |
| Idaho | 50,629,680 | 2,045 | 24,757.79 | 17,412,873 |
| Illinois | 335,184,473 | 14,150 | 23,687.95 | 131,696,173 |
| Indiana | 162,061,174 | 10,410 | 15,567.84 | 55,751,807 |
| Iowa | 59,773,048 | 3,477 | 17,190.98 | 12,419,772 |
| Kansas | 94,113,004 | 2,599 | 36,211.24 | 44,027,464 |
| Kentucky | 48,699,325 | 4,154 | 11,723.48 | 20,269,246 |
| Louisiana | 77,795,378 | 4,375 | 17,781.80 | 25,777,537 |
| Maine | 18,962,552 | 1,483 | 12,786.62 | 4,516,013 |
| Maryland | 221,331,590 | 8,828 | 25,071.54 | 84,201,661 |
| Massachusetts | 235,417,890 | 8,234 | 28,590.95 | 76,611,310 |
| Michigan | 203,276,385 | 13,712 | 14,824.71 | 65,458,059 |
| Minnesota | 193,791,800 | 6,316 | 30,682.68 | 69,732,152 |
| Mississippi | 32,143,424 | 2,750 | 11,688.52 | 11,217,583 |
| Missouri | 123,249,884 | 7,442 | 16,561.39 | 42,906,774 |
| Montana | 45,551,682 | 1,450 | 31,414.95 | 32,204,310 |
| Nebraska | 40,580,996 | 2,010 | 20,189.55 | 10,538,005 |
| Nevada | 200,808,805 | 9,238 | 21,737.26 | 91,121,172 |
| New Hampshire | 27,165,110 | 1,520 | 17,871.78 | 6,995,141 |
| New Jersey | 440,841,380 | 11,259 | 39,154.58 | 152,042,523 |
| New Mexico | 45,127,285 | 2,602 | 17,343.31 | 19,118,260 |
| New York | 748,563,870 | 24,770 | 30,220.58 | 230,500,311 |
| North Carolina | 234,703,617 | 11,266 | 20,832.91 | 79,373,853 |
| North Dakota | 13,532,372 | 705 | 19,194.85 | 5,656,646 |
| Northern Mariana Islands | 25,917 | 16 | 1,620.00 | 18,309 |
| Ohio | 197,281,703 | 12,596 | 15,662.25 | 69,624,975 |
| Oklahoma | 66,947,770 | 4,516 | 14,824.57 | 22,651,833 |
| Oregon | 135,527,400 | 5,995 | 22,606.74 | 42,932,641 |
| Pennsylvania | 359,154,607 | 15,073 | 23,827.68 | 108,854,185 |
| Puerto Rico | 30,093,505 | 2,534 | 11,875.89 | 16,643,124 |
| Rhode Island | 30,921,954 | 1,278 | 24,195.58 | 14,195,616 |
| South Carolina | 119,817,544 | 9,193 | 13,033.56 | 42,579,581 |
| South Dakota | 35,848,890 | 1,629 | 22,006.69 | 17,000,000 |
| Tennessee | 161,105,497 | 7,874 | 20,460.44 | 54,135,338 |
| Texas | 1,020,732,548 | 43,908 | 23,247.07 | 362,410,519 |
| United States Minor Outlying Islands | 3,588,798 | 121 | 29,659.49 | 2,913,146 |
| Utah | 132,165,965 | 4,565 | 28,952.02 | 38,595,361 |
| Vermont | 8,817,472 | 638 | 13,820.49 | 3,569,834 |
| Virgin Islands | 2,635,005 | 120 | 21,958.38 | 2,137,025 |
| Virginia | 264,636,809 | 11,598 | 22,817.45 | 97,056,870 |
| Washington | 288,477,780 | 13,417 | 21,500.92 | 121,937,028 |
| West Virginia | 21,445,053 | 2,188 | 9,801.21 | 5,777,824 |
| Wisconsin | 91,331,107 | 6,466 | 14,124.82 | 30,437,803 |
| Wyoming | 13,732,961 | 776 | 17,697.11 | 5,725,712 |
Top Cybercrime Attack Statistics

(Source: deepstrike.io)
- Phishing and spoofing dominate cybercrime, with APWG reporting 1,003.94 attacks in the first quarter of 2025.
- Ransomware continues with a more than 73% YoY increase and more than USD 1 billion in crypto ransoms.
- Meanwhile, business fraud has collectively cost USD 51 billion globally, and non-ransom malware has experienced a 349% surge in email-borne detections.
- Identity fraud in the U.S. reached USD 27.2 billion in 2024, and data breaches incurred an average cost of USD 4.45 million in 2023.
Banking Scams Statistics
- A BioCatch report, based on data from financial institutions serving nearly 350 million consumers across five continents, found scam attempts rose 65% in the past year.
- It reported a 100% increase in voice phishing (vishing), a 63% increase in attempted romance scams, and a 42% increase in attempted investment scams, while SMS phishing increased 10-fold.
- Purchase scams remained the most common type, with attempts up 14%.
- Additionally, consumers lose USD 1.03 trillion each year, and the U.S.
- Clients also observed a 15% decline in impersonation scams and launched Scams360 in July.
Digital Payments Fraud Statistics
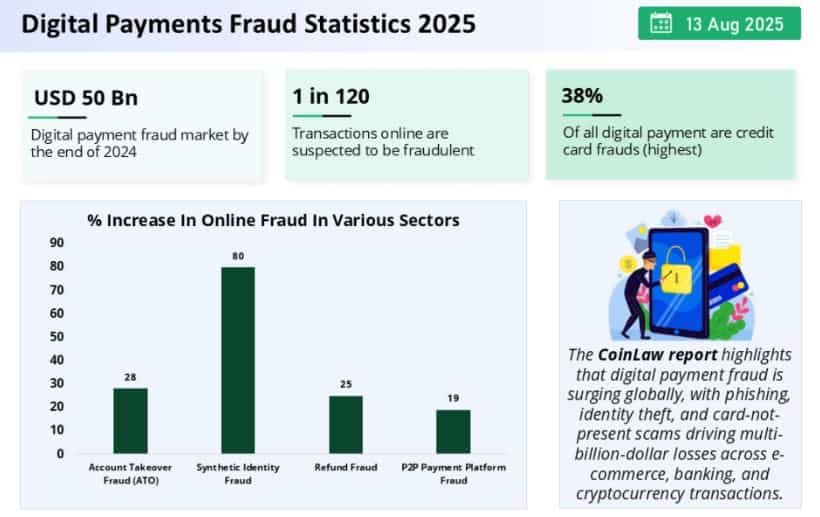
(Source: cloudfront.net)
- The digital payment fraud market reached around USD 50 billion by the end of 2024.
- Only 1 in 120 online transactions was termed as potentially fraudulent.
- Credit card fraud accounted for the largest share, with 38% of all digital payment fraud.
- In online banking fraud trends, synthetic identity fraud accounted for the largest share (80%, followed by account takeover (28%), refund fraud (25%), and P2P payment platform fraud (19%).
Americans’ Experience With Online Scams And Attacks
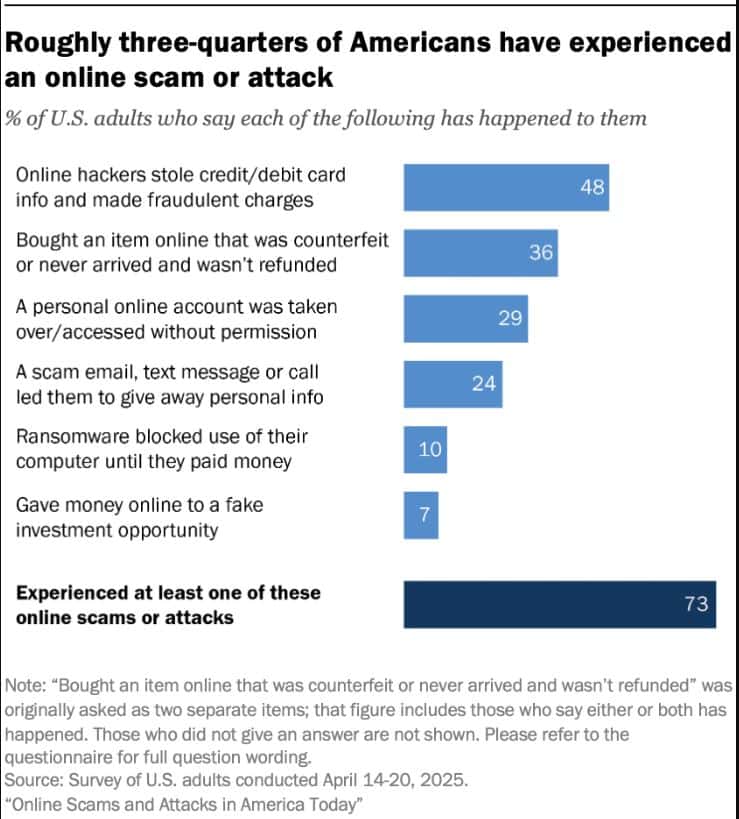
(Source: pewresearch.org)
- From April 14 to 24, 2025, approximately 73% of U.S. adults experienced at least one online scam or attack.
- The most common issue was stolen card details and fake charges (48%).
- Another 36% paid for counterfeit or undelivered items and received no refund.
- Account takeovers affected 29%, and 24% shared personal information after a scam message or call.
- Fewer people reported ransomware (10%) or fake investment losses (7%).
Online Scam Experiences By Demographics
- In the United States, approximately 30% of Americans experienced an online scam in 2025.
- Followed by 22% experienced two scams, 22% (three or more), and 73% (at least one).
Other demographic analyses in the U.S. are mentioned below:
| Metrics | One | Two | Three+ | At least one |
| Age group (year) | ||||
| 18-29 | 29% | 20% | 24% | 73% |
| 30-49 | 30% | 23% | 23% | 77% |
| 50-64 | 32% | 24% | 21% | 76% |
| 65+ | 29% | 19% | 19% | 66% |
| Ethnicity | ||||
| White | 32% | 24% | 18% | 74% |
| Black | 25% | 17% | 31% | 73% |
| Hispanic | 25% | 19% | 28% | 73% |
| Asian | 31% | 17% | 24% | 71% |
| Income Level | ||||
| Lower | 26% | 19% | 27% | 72% |
| Middle | 31% | 24% | 20% | 75% |
| Upper | 35% | 22% | 18% | 75% |
Bank-Fraud Statistics By Identity Theft & Account Takeover
- The Federal Trade Commission reported that 2024 saw 6.5 million consumer reports, including more than 1.1 million identity theft reports.
- The biggest identity-theft categories were credit card (449,032 reports), loan/lease (176,400), bank account (114,608), and other identity theft (358,993).
- According to Javelin’s 2025 Identity Fraud Study, identity fraud, including account takeover (ATO), resulted in USD 27.2 billion in consumer losses in 2024, a 19% increase.
- Alloy’s 2025 State of Fraud Report found that 60% of financial institutions/fintechs, and about 70% of enterprise banks, reported fraud rising.
- More than 1 million in direct losses, and 64% planned new identity-risk investments.
- According to a NICE survey, 66% reported a major impact from ATO, 54% reported identity theft, and 72% reported close monitoring of phishing.
- In addition, Veriff reported that, in 2025, deepfakes accounted for 1 in 20 ID-check failures.
By Phishing Scams and Social Engineering
- The APWG reported that phishing attacks totalled 1,003,924 in the first quarter of 2025, with online payment and banking targeted in 30.9% of incidents.
- In the second quarter, phishing attacks totalled 1,130,393 (an increase of 13% from the previous quarter).
- The Financial Institutions sector is the most targeted, accounting for 18.3% of all phishing attempts.
- The total number of number of number of attacnumber of ks declined to 892,494 in the third quarter of 2025, and financial institutions accounted for 13.2% of incidents.
- Meanwhile, QR-code traps surged to 716,306 unique malicious codes, up 13% from Q2, and exceeded 3 million over the past 12 months.
- The FBI’s report logged 859,532 complaints and USD 16 billion in phishing and spoofing losses on April 23, 2025.
- IC3 also shows that 21,442 BEC cases totalling USD 2,770,151,146.
Credit Card Fraud Statistics
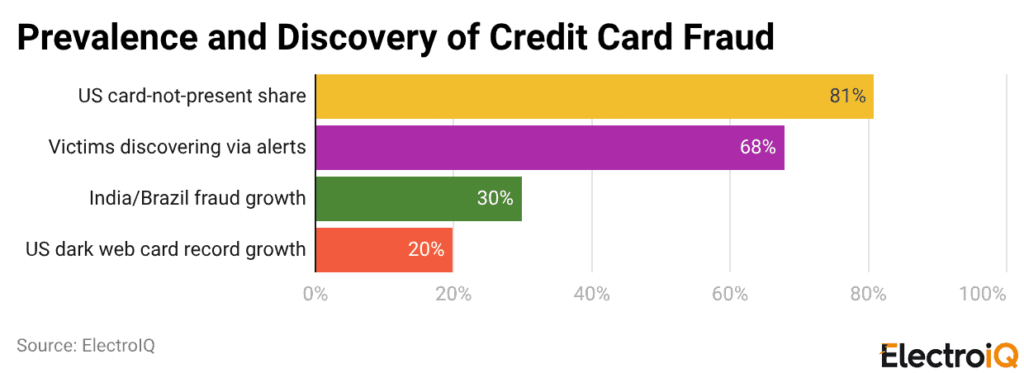
(Reference: coinlaw.io)
- In 2025, credit card fraud is expected to account for approximately 38% of FTC identity-theft complaints, with 323,000 cases reported in the first half of the year.
- In the U.S., 81% of fraud losses originated from card-not-present transactions as online shopping continued to grow.
- 68% of victims detected fraud through bank alerts or statements rather than through real-time tracking.
- India and Brazil reported a 29.5% increase in credit card fraud cases in 2025, linked to the expansion of digital payments.
- Dark-web selling increased by 20%, with 14.5 million U.S. card records listed.
- Globally, one fake card transaction happens every 14 seconds, while the U.S. recorded USD 13.7 billion in losses.
Financial Impact On Banks And Consumers
- In 2024, global banking fraud costs were expected to pass USD 45 billion as attacks became more advanced, according to coinlaw.io.
- For financial institutions, each fraud incident costs about USD 4.3 million, including investigation, recovery, and regulatory fines.
- Consumer confidence declined by 15%, and 4 out of 10 people reported hesitating to adopt new banking technology.
- Fraud-related lawsuits against banks increased by 8%.
- Businesses lost USD 14 billion, with small firms making up 47% of reported cases.
- The sector spent USD 12.6 billion on anti-fraud tools and services, up 20% year over year, while insurance claims jumped 26%.
Financial Cybersecurity Regulation Challenges
- The top issue was the presence of too many or conflicting regulations across countries (34%), particularly in the U.S.
- Meanwhile, 25% reported that meeting cyber-regulation requirements was not a challenge.
- Resource constraints, such as limited money or people, affected 22%.
- A smaller share reported their country or industry lacked cyber regulations (9%).
- Others found requirements technically too hard to meet (7%) or not appropriate for their organisation (3%).
- Regulatory complexity accounted for 34%, while capability and fit concerns accounted for 3%.
The Rise of AI-Driven Fraud (Deepfakes & Voice Cloning)
- According to Deloitte research, Generative AI-enabled fraud across the financial sector is projected to reach approximately $40 billion annually by 2027, a massive escalation from $12.3 billion in 2023.
- According to McAfee, Scammers can now create a functional voice clone with as little as 3 to 20 seconds of audio, achieving 85% to 95% accuracy with the original person.
- Fourthline state that Deepfake-related fraud losses exceeded $410 million in the first half of 2025 alone, with individual successful incidents now frequently exceeding $680,000 per event.
- JMB Financial Managers reports, Global deepfake fraud incidents surged by 700% in the first quarter of 2025 compared to the previous year, highlighting the rapid adoption of these tools by criminal networks..
- According to IBM X-Force, AI-powered phishing and social engineering attacks are now 192 times faster to produce than manual efforts, allowing a single attacker to generate in one day what previously took a team months to coordinate.
- As of 2026, more than 40% of financial professionals have directly encountered deepfakes used in fraud attempts, while 90% of institutions report that fraudsters are actively using generative AI in their daily operations.
- Approximately 82.6% of all phishing emails now contain AI-generated content, leading to click-through rates of 54%, compared to just 12% for traditional non-AI phishing.
- Synthetic identity document fraud, often paired with deepfake video to bypass “liveness” checks during bank onboarding, increased by 378% in the lead-up to 2026.
- According to Vectra AI, in one high-profile case of AI-enabled social engineering, a single deepfake video call involving a synthetic CFO resulted in a $25.6 million loss for a single firm.
- Consumer vulnerability is high: 77% of victims who received a message from an AI voice clone reported losing money, with 36% losing between $500 and $3,000.
- Monthly media-reported AI content incidents, including deepfakes and retail scams, reached nearly 500 per month by January 2026, a tenfold increase since 2020.
- Multi-step, coordinated fraud attacks leveraging AI rose by 180% year-on-year, signalling a shift toward complex, “fewer but smarter” criminal operations.
- Industry surveys indicate that 75% of consumers now feel more vulnerable to financial fraud due to the proliferation of AI, while 68% consider identity theft their primary digital concern.
- According to Statista, as of early 2026, 1 in 17 teenagers has already been targeted by deepfake content, indicating that scammers are harvesting voice and image data from younger, highly active social media users.
- The World Economic Forum reports that 73% of CEOs have been personally affected by cyber-enabled fraud or know someone in their professional network who has been affected in the past year.
The Industrialised “Scam-as-a-Service” Economy (2026)
- According to Cybersecurity Ventures, Cybercrime has evolved into the world’s third-largest economy, with annual global losses projected to reach $10.5 trillion in 2025 and continue rising through 2026, marking a 15% year-over-year increase.
- As per DeepStrike, the barrier to entry for financial fraud has vanished, as criminals can now rent a professional phishing kit for approximately $250 per month or purchase a basic malware package with a step-by-step tutorial for just $50.
- Flare reports that Banking remains the primary target for organised cybercrime, with approximately 82% of all multi-target phishing “combo kits” sold on the dark web including specialised tools to impersonate major financial institutions.
- Modern phishing kits have transitioned from simple fake websites to “Adversary-in-the-Middle” (AiTM) systems that can intercept live session cookies and bypass multi-factor authentication (MFA) in real time.
- Advanced subscription models for banking attack infrastructure now range from $150 to $1,500 per month, offering non-technical buyers features like dedicated hosting and automated exfiltration via Telegram bots.
- A criminal making a modest $34 monthly investment in pre-packaged fraud tools can generate an estimated $25,000 in monthly illicit revenue by targeting retail banking customers.
- According to Keepnet Labs, The industrialization of these attacks has made phishing the origin of 91% of successful cyberattacks across the financial sector, as AI-enhanced kits increase user click rates by up to 4x compared to traditional methods.
- Financial institutions are seeing a surge in “Phishing-as-a-Service” (PhaaS) offerings, which accounted for over 54% of all threat-related posts on dark web messaging platforms like Telegram in early 2026.
- As per Flare 2026 Report, The “fraud trifecta” preferred by these automated kits consists of banking, e-commerce (76% of kits), and PayPal (75% of kits), designed to maximize the speed of cash-outs from a single victim.
- Banking Trojans and info-stealers are sold as “stealer logs” on specialised dark web markets like STYX and Russian Market, where breached credentials and payment data for thousands of accounts are traded daily.
- Individuals in the banking sector who fall victim to phishing lose an average of $225 per successful attack, while the total cost of a single phishing-related breach for a financial organisation has risen to roughly $4.9 million.
- According to Astra Security, in 2026, a cyberattack is estimated to occur every 39 seconds, fueled by the widespread availability of automated tools that require no coding knowledge to operate.
Conclusion
Banking fraud, scams, and cybercrime are increasing rapidly as criminals exploit technology and people’s trust to steal money and personal information. As online banking becomes more popular, crimes such as phishing texts, fake apps, identity theft, and unauthorised account access are on the rise.
To prevent such fraud incidents, banks need to implement stronger security measures, round-the-clock transaction monitoring, and clear guidance for customers. Similarly, users need to remain vigilant, verify messages and links, create strong passwords, and report suspicious activity immediately. When protection improves, rules are enforced, and awareness increases, fraud can be reduced, and digital banking remains secure.