
Introduction
AWS CloudWatch Statistics: Visualise CloudWatch as the telemetry backbone of contemporary cloud activities: it is the monitor that gauges the pulse of your application, the detector that identifies the bottlenecks, and the item on the invoice that causes the finance departments to frown at the end of the month. In 2026, the use of Amazon CloudWatch by companies that implement AI at scale, process large volumes of data, and distribute services goes beyond being a mere “nice-to-have” utility.
It is regarded as a strategic tool whose patterns of use, cost drivers, and operational impact are measurable; thus, it is maturing and undergoing increasing scrutiny. The content of this article is a combination of public pricing rules, market research, and 2026 usage studies that provide a clear view of CloudWatch at present — allowing the engineering, SRE, and FinOps teams to base their decisions on evidence rather than intuition.
Editor’s Choice
- With a 30% global market share, AWS is the leading cloud provider, thereby strengthening CloudWatch’s position as a major monitoring solution in current cloud infrastructures.
- By 2026, CloudWatch will have undergone a transformation, evolving from a simple monitoring utility into a strategic observability platform that is paramount for AI, distributed systems, and large-scale cloud operations.
- CloudWatch has created an ecosystem of over a thousand metric types, and the use of high-resolution metrics with time intervals of less than a minute has surged by 41%, indicating increased demand for nearly real-time visibility.
- The CloudWatch Agent has become widely adopted; therefore, we can now obtain 1-second EBS metrics for 62% of provisioned IOPS volumes and monitor more than 25 disk-level metrics.
- The performance of the EBS has been consistently good, as it has been found that 95% of the monitored volumes have less than 1 ms read latency, and also the high-performance workloads have been able to reach more than 3,500 IOPS per volume.
- CloudWatch Dashboards have now improved their metrics support by allowing 100 cross-region metrics, which means centralized global architecture monitoring has become possible.
- According to statistics, 64% of AWS accounts use the Embedded Metric Format (EMF), which enables the retrieval of metrics in a structured form directly from logs.
- The use of CloudWatch Metrics Explorer increased by 46%, while 28% of enterprise customers were found to be using Managed Grafana for advanced visualisation.
- Centralised monitoring across multiple accounts becomes easier with cross-account observability enabled in 58% of AWS Organisations.
- CloudWatch RUM has seen its usage triple and now covers 2.4 billion user sessions per month, indicating rising concern about monitoring real-user performance.
Global Cloud Market Share

(Reference: sqmagazine.co.uk)
- The global cloud infrastructure market remains highly competitive, with AWS leading with 30% market share, reinforcing its position as the cloud provider of choice worldwide.
- Its wide range of services, global infrastructure, and mature ecosystem are the main reasons enterprises and startups remain attracted to it.
- Microsoft Azure has the second-largest market share, at 21%, owing to strong integration with enterprise software and hybrid cloud offerings.
- Google Cloud ranks third with a 12% market share, supported by its strengths in data analytics, AI, and open-source technologies.
- Alibaba Cloud has 4% of the global market share, is strongly present in Asia, and is slowly making a mark in emerging markets.
- Oracle Cloud comes next with 3%, backed by the need for enterprise databases and mission-critical workloads.
- Other important players like Salesforce, IBM Cloud, and Tencent Cloud share about 2% of the total market, each catering to specific enterprise, SaaS, or regional cloud application needs.
CloudWatch Pricing & FinOps (Cost Optimisation Statistics)
- Data ingestion is the primary financial driver for most engineering teams, costing $0.50 per gigabyte in the standard tier and often accounting for up to 90% of an organisation’s total observability spend, according to research by the Hykell FinOps team.
- The long-term archival of log data introduces a compounding expense, as organisations are charged $0.03 per gigabyte per month for compressed storage, which accumulates indefinitely and traps budgets if default retention settings are not actively modified, as noted by the SigNoz engineering team.
- Querying historical data using CloudWatch Logs Insights incurs a separate computational charge of $0.005 per gigabyte of data scanned, meaning a single complex query executed over 1 terabyte of historical log data costs an organisation exactly $5.00.
- Real-time troubleshooting features have distinct pricing models: Live Tail analysis costs $0.01 per minute of usage, and Data Protection scanning for sensitive information adds a 24% surcharge, equating to $0.12 per gigabyte scanned, on top of standard ingestion fees.
- Custom metrics incur substantial costs at $0.30 per metric per month for the first 10,000 metrics. Because every unique combination of metric names and dimensions counts as a separate billable entity, stripping high-cardinality dimensions can reduce metric costs by 50 to 90%, according to optimisation data published by OneUptime.
- Alarm configurations compound rapidly based on resolution intervals, with standard 60-second resolution alarms costing $0.10 per metric per month, high-resolution 10-second alarms costing $0.30, and composite alarms costing $0.50, meaning a simple upgrade of 20 standard alarms to high-resolution anomaly detection jumps the monitoring cost from $2.00 to $18.00 per month.
- Financial operations teams are actively transitioning non-critical data streams, such as debug web server logs or compliance records, to the CloudWatch Infrequent Access log class, which strictly charges $0.25 per gigabyte for ingestion and delivers an immediate 50% savings compared to standard tier pricing, according to cost analysis from the Vantage research team.
- Organisations generating massive log volumes can leverage volume-based discount tiers where vended log ingestion costs drop from $0.50 per gigabyte for the first 10 terabytes down to $0.05 per gigabyte for volumes exceeding 50 terabytes, representing a potential 58% reduction in monthly bills for enterprise deployments.
- To combat the hidden costs of indefinite storage, financial operations engineers are applying strict 30-day or 60-day lifecycle retention policies that automatically delete older logs, a straightforward architectural adjustment that successfully cuts monthly log storage bills by 30 to 70%.
- Financial operations practitioners are exporting older compliance logs directly to Amazon S3 or Amazon S3 Glacier rather than keeping them in native CloudWatch storage, leveraging lifecycle rules that yield up to a 90% reduction in long-term data archiving expenses.
- Automating the consolidation of custom dashboards prevents resource sprawl, as Amazon Web Services charges $3.00 per dashboard per month, while reducing the refresh intervals on associated widgets can independently cut application programming interface request costs by 40 to 80%.
Types Of AWS CloudWatch Metrics
- AWS CloudWatch offers a variety of metrics to monitor the performance, availability and health of cloud resources in the organisation.
- In 2026, standard metrics will be automatically enabled for more than 80 AWS services, so users can monitor basic metrics such as CPU usage, network traffic, and request counts without any additional setup.
- The adoption of custom metrics has soared, up 23% compared to the previous year, mostly because of the advent of containerised apps and microservices, which in turn demand monitoring specific to the application.
- There are more than 1,000 metric types in CloudWatch, organised into namespaces, which facilitate data management and analysis for mixed workloads.
- The demand for high-resolution metrics, which provide data granularity of less than a minute, has increased by 41% over the past year, as companies seek faster insights and real-time alerting.
- Approximately 30% of CloudWatch users mix built-in and custom metrics to get complete visibility across their infrastructure and applications.
- Additionally, 14 AWS regions already provide enhanced metric data with latency under 5 seconds, thereby facilitating fast, responsive monitoring and incident resolution for mission-critical applications.
Serverless and AWS Lambda Observability
- According to the AWS Compute Blog, serverless systems are highly efficient, and cold starts typically affect less than 1% of all application requests but can cause users to experience a wait of up to 5 seconds while a new execution environment is provisioned.
- OneUptime Blog Reports, The time it takes for a function to initialise from a cold start depends heavily on the programming language used, with Go taking between 50 and 100 milliseconds, Node.js taking 20, Python 3.12 taking between 100 and 200 milliseconds, .NET 8 taking between 300 and 1000 milliseconds, and Java 21 taking between 500 and 3000 milliseconds.
- Lumigo Blog Study states that including basic dependencies like the Node.js AWS SDK inside a deployment package adds 20 to 60 milliseconds to the total cold start delay, while increasing the total file size to 60 megabytes can drastically increase the delay by 250 to 450 milliseconds.
- To optimise cloud expenditures, the AWS platform automatically turns off inactive functions, meaning an unreserved serverless application will remain warm for only 30 to 45 minutes of inactivity before it is shut down and forced to execute a cold start on the next incoming request.
- When tracking the financial metrics of concurrent executions, standard on-demand requests cost $0.06 per gigabyte-hour, rounded up to the nearest 100 milliseconds. While keeping instances permanently warm with Provisioned Concurrency lowers the execution cost to $0.035 per gigabyte-hour, it adds an extra $0.015 per gigabyte-hour for uptime, rounded to the nearest 5 minutes.
- For teams adopting CloudWatch Lambda Insights to track their system health, the base monitoring tier supports up to 5 gigabytes of log data, handles 1 million API requests per month, and allows building 3 visual dashboards with up to 50 metrics each.
- Advanced observability setups allow engineers to monitor high-resolution concurrent executions by pulling metric data points with a 1-second refresh rate, making it easy to spot hidden performance problems by isolating the 90th, 95th, or 99th percentile of the longest-running functions.
- To prevent application requests from being dropped, proactive monitoring rules are configured to trigger automated alerts whenever the active number of running concurrent functions surpasses 80% of the system’s reserved capacity limit, or whenever the 99th percentile of execution time unexpectedly spikes beyond 10,000 milliseconds
CloudWatch Agent Gives A Complete Picture Of EBS Performance
- With the CloudWatch Agent in place, the Amazon EBS performance visibility is so deep and clear that it can even detect issues before they become noticeable by default monitoring.
- Thanks to the agent, EBS metrics such as VolumeQueueLength, throughput, and BurstBalance can be gathered every second, allowing teams to spot performance issues almost in real time.
- This thorough monitoring is now applied to 62% of provisioned IOPS (io1/io2) volumes, underscoring its importance for latency-sensitive workloads.
- Over the last 12 months, the CloudWatch Agent has expanded its coverage by adding one disk-level EBS metric, bringing the total to more than 25, up from 16.
- The new metrics will enable teams to conduct a more detailed analysis of read/write behaviour, queue depth and throughput limits.
- For workloads that require high performance, the median VolumeReadOps is over 3,500 IOPS per volume, indicating robust, consistent disk activity.
- For GP3 volumes, monitoring BurstBalance has become increasingly critical, with 48% utilising alarms to mitigate unexpected performance throttling and latency spikes.
- In hybrid environments, it is estimated that 71% of organisations use CloudWatch Agent memory and disk metrics, providing consistent visibility across on-premises and cloud infrastructure.
- Agent-based monitoring for both EC2 and EBS is now a major component of alerting strategies and is responsible for 40% of composite alarms in 2026.
- The EBS latency is still under strict optimization, with 95% of monitored volumes keeping read latency under 1 millisecond.
- In general, 55% of the performance-critical EC2 workloads depend on the metrics gathered by the agent, and the sharing of multi-volume dashboards that aggregate the agent data has increased by 31% per year in the DevOps teams.
Metric Query & Visualisation Tools
- CloudWatch’s querying and visualisation features have significantly expanded and are now able to support complex multi-environment monitoring.
- Cross-region metrics—100 of them, to be precise—can now be viewed on a single CloudWatch Dashboard, making it much simpler to keep an eye on the whole global architecture via a single interface.
- The use of the CloudWatch Embedded Metric Format (EMF), which allows structured metrics to be extracted straight from application logs, has reached 64% of AWS accounts.
- The CloudWatch Metrics Explorer usage has increased by 46% largely due to the introduction of improved tag-based filtering, which makes it very easy to discover metrics even when they are in large numbers.
- To meet the more advanced visualization requirements, 28% of enterprise AWS customers are using Amazon Managed Grafana, which is connected to CloudWatch for creating richer dashboards and doing analytics.
- AWS Console Dashboards are rendering metrics close to real-time now, with the refresh intervals being less than five seconds, thereby enhancing operational responsiveness.
- CloudWatch Logs Insights is now fully integrated with the dashboards across all commercial regions, enabling teams to easily correlate logs and metrics.
- Among the features for visualization of alarm heatmaps introduced in 2026 is one that illustrates incident frequency and problem areas across environments.
- Moreover, 33% of organizations employ CloudWatch Contributor Insights for top-N analysis of high-volume log and metric data.
- The feature of exporting dashboards as PDFs or email snapshots has also been well received, with adoption growing 39% year on year, thereby aiding in reporting and communicating with stakeholders.
Case Study: Analysing a Containerised Workload’s Log Footprint
(Source: sqmagazine.co.uk)
- The team is now in a position to comprehend the cost factors related to logging and the chances for optimisation.
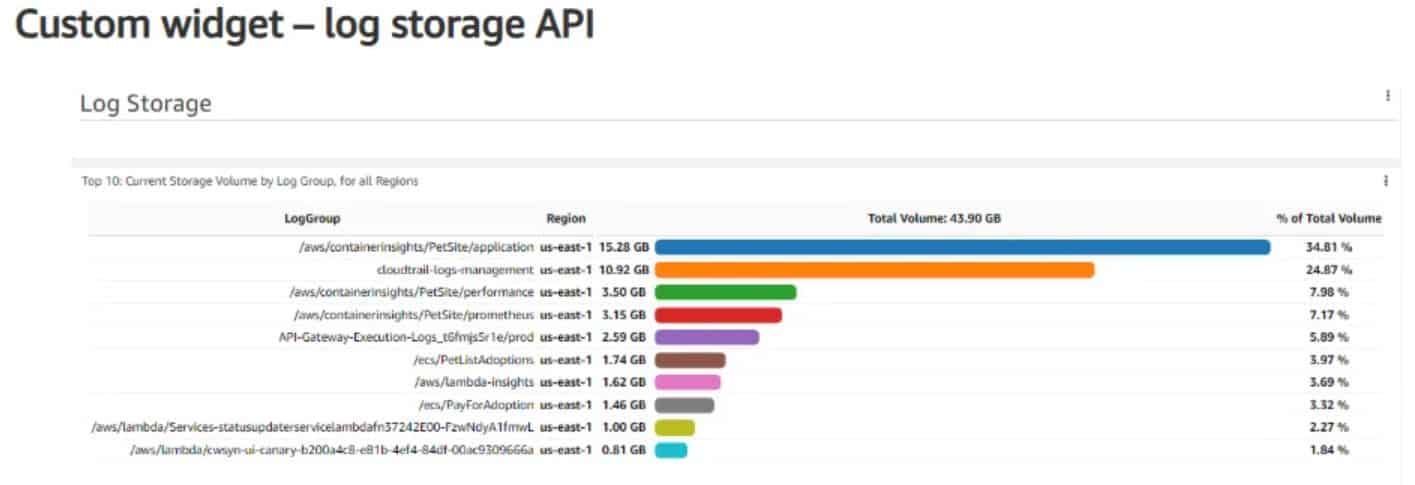
- The log group /aws/containerinsights/PetSite/application accounts for the largest share of the storage, with 15.28 GB, representing 34.81% of the total logging volume.
- This reveals that a lot of logging at the application level is occurring with containerised workloads, most likely due to either verbose logs or high traffic.
- The cloudtrail-logs-management log group is ranked second, consuming 10.92 GB (24.87% of the total storage).
- This indicates the substantial volume of logs generated by governance, audit, and security that must be tracked across the AWS environment.
- The Container Insights-related log groups are also contributing significantly to the logging volumes. The /aws/containerinsights/PetSite/performance logs consume 3.50 GB (7.98%), and /aws/containerinsights/PetSite/prometheus consumes 3.15 GB (7.17%), reflecting the impact of performance metrics and Prometheus monitoring data on storage.
- The execution logs of the API Gateway for the production traffic (API-Gateway-Execution -Logs_cf6mj5riej/prod), which is 2.58 GB or 5.89% of the storage, reflect logging at the request level for the APIs.
- The application logs, such as/aws/PetSite/adoptions, consume 1.65 GB (3.79%), indicating moderate usage by business workflows.
- Lambda monitoring and execution have also produced logs that have a significant amount of storage. /aws/lambda-insights is taking 1.62 GB (3.69%), whereas /aws/PayForAdoption is contributing 1.46 GB (3.32%).
- Additionally, the smaller Lambda log groups include /aws/lambda/Services-statusupdater…and /aws/lambda/cwsyn-ui-canary… which store 1.00 GB (2.27%) and 0.81 GB (1.84%) respectively.
Recent Trends & Developments
- At the beginning of 2025, AWS CloudWatch Logs Data Protection was updated to include automatic PII redaction, helping companies mask their confidential data in log files without intervention.
- In the first quarter of 2025, AWS introduced six new CloudWatch metric namespaces, including AWS/Bedrock and AWS/SupplyChain, thereby increasing monitoring coverage for new AWS services.
- The feature of cross-account observability has gained a lot of popularity and is currently activated in 58% of AWS Organisations, making it so much easier to have one centralised monitoring system for all the different accounts.
- In the meantime, AWS rolled out a project to test AI-based alarm recommendations in five preview regions starting in the second quarter of 2025, with the goal of eliminating alert noise and improving incident response accuracy.
- CloudWatch Real User Monitoring (RUM) has also experienced a significant increase in usage, with monthly user sessions supported tripling to approximately 2.4 billion due to growing demand for user performance insights.
- Midway through 2025, AWS introduced the Observability Access Manager, which not only simplified permissions management but also enabled secure sharing of metrics, logs, and traces within teams.
- In fact, one of the main reasons Metric Streams was introduced for Amazon OpenSearch was to achieve a 44% increase in monitoring via streaming, thereby supporting real-time analytics at scale.
- Moreover, AWS offers another service: Application Signals, a preview feature under development that correlates metrics from multi-tier, distributed applications, thereby supporting teams’ efforts to gain end-to-end visibility.
- Furthermore, the redundancy of CloudWatch dashboards across regions is being implemented in stages, with full availability expected by the end of 2025, thereby significantly improving the resilience and availability of the monitoring sites.
AIOps and Machine Learning in CloudWatch
- Amazon CloudWatch Anomaly Detection utilises machine learning algorithms that train on up to 14 days of historical metric data to automatically calculate normal system baselines.
- The anomaly detection model evaluates statistical deviations using standard deviation thresholds: σ=1 ignores 68% of typical variance, σ=2 ignores 95% of typical variance, and σ=3 only alerts on anomalies falling outside 99.7% of historical data patterns.
- Deploying these automated machine learning bands rather than static thresholds successfully reduces operational incident alerts by 15% to 40%, depending on the specific workload type.
- The algorithm dynamically recalibrates hourly, daily, and weekly, enforcing logical boundaries that prevent percentage-based metric bands from exceeding 100 or dropping below 0.
- Integrating the Amazon Q Developer CLI with the Model Context Protocol enables natural language queries that can instantly identify infrastructure anomalies, such as isolating a scenario where CloudWatch accounts for more than 50% of total monthly AWS service expenses.
- By executing conversational prompts through Amazon Q, engineering teams successfully pinpointed a single AWS Lambda log group that was independently responsible for 99.9% of an organisation’s entire log storage costs.
- Administrators can bypass complex query syntax entirely by asking Amazon Q to retrieve exactly 10 of the slowest executing AWS Lambda requests processed over a rolling 24-hour period.
- AWS Predictive Scaling leverages machine learning models to analyse up to 15 months of historical traffic data captured at 1-minute intervals to forecast capacity demands.
- Systems utilising predictive autoscaling require at least 24 hours of performance history to initiate forecasting, while optimal machine learning accuracy is achieved after 14 days of metric data.
- Pre-provisioning EC2 capacity ahead of forecasted demand spikes yields a 30% improvement in resource availability during peak operational hours.
- Combining machine learning-based predictive scaling with dynamic scaling policies and Spot Instances reduces overarching cloud compute expenditures by 30% to 50%.
- Organisations that transition to autonomous predictive scaling configurations experience up to a 75% increase in application performance and a 70% reduction in availability-related downtime incidents.
Conclusion
AWS CloudWatch Statistics: In 2026, AWS CloudWatch has evolved to the point that it is now considered a pivotal component of cloud observability rather than merely a basic monitoring tool. Its widespread use, the variety of available metrics, and its deep integration with AI, containers, and distributed architectures demonstrate that it is a major player in engineering, SRE, and FinOps.
Improved monitoring using agents, quicker metric transfer, and state-of-the-art visualisation tools are enabling earlier issue detection and handling large-scale operations with confidence. However, the increase in log volumes, along with the introduction of new features, indicates a strong need for cost-effective monitoring strategies. All in all, CloudWatch is a good example of the transition to data-driven, proactive, and application-centric cloud operational models.