
Introduction
Email Spam Statistics: Email is one of the main ways we stay in touch at work and in our personal lives. But this same channel is often misused. Spam is not just boring or unwanted advertising in your inbox. It is also a popular way for attackers to send phishing links, spread malware, run scams, and send fake business emails that fool people and organisations every day.
In this article on email spam statistics, we examine key metrics and trends. These statistics show the extent of spam, which attack types are increasing, who is targeted most, and how patterns change as new tools and defences emerge. Understanding these facts helps us see the real risks and improve email security.
Editor’s Choice
- Gmail is the most used mailbox provider, with 72.1% of users receiving emails in 2025.
- China and the United States are tied as the top sources of spam, each sending approximately 7.8 billion spam emails per day.
- In 2024, Yahoo and Google set a very strict spam complaint limit of 0.3%.
- A report published by emailwarmup.com states that marketing and advertising spam accounts for 36% of all spam.
- According to the Secure List 2025 report, Russia accounts for 36.18% of global spam emails.
- Around 40.8% of people handle spam emails by deleting them, making this the most common response.
- In 2025, email traffic will reach 376 billion messages per day.
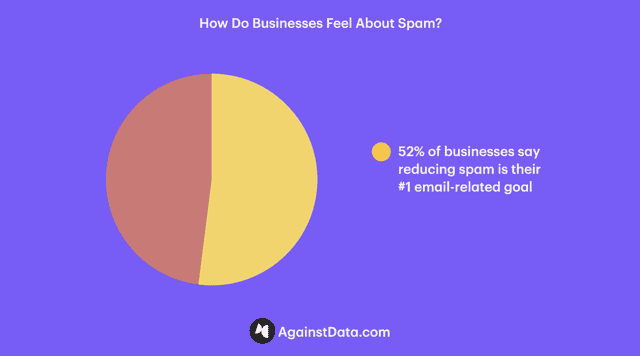
- About 52% of businesses say reducing spam is their top email-related goal.
- As of 2025, the most common spam email topics are prizes or giveaways (36.7%), followed closely by job opportunities (36.3%) and banking messages (34.6%).
- Financial services get 45.8% of spam attacks, the largest share.
- As of 2024, Securelist reported that 47.27% of all email messages were labeled as spam globally.
- A report by SQ Magazine further stated that spam email costs companies USD 20.5 billion in lost productivity annually.
- Gmail blocks over 99.9% of spam, phishing, and malware before inbox delivery.
- According to emailtooltester.com, a short email sent and read on a phone produces 0.2 g of CO2, and a spam message caught by filters still creates about 0.03 g.
General Email Spam Statistics
- In a 2025 report, Debounce predicts 376.4 billion emails will be sent and received each day worldwide, with 4.6 billion users.
- Approximately 84.9% of people check their inboxes at least twice daily.
- Every minute, approximately 241 million emails are sent, and spam accounts for 45.6% of all email traffic.
- China and the United States are tied as the top sources of spam, each sending approximately 7.8 billion spam emails per day.
- The report adds that 28% of unsubscribes are due to messages appearing spam-like.
- 40% of unsubscribes are due to email relevance.
- Around 27% of people unsubscribe because they receive emails too often.
- 28% of people unsubscribe when emails look like spam, and 40% leave because the content does not feel relevant.
- Another 27% opt out after receiving frequent messages.
- For 48% of marketers, avoiding the spam folder is a major problem because real emails can be hidden there.
- When this happens often, 52.7% of consumers feel annoyed, lose trust, or unsubscribe from the brand.
- In 2024, Yahoo and Google set a very strict spam complaint limit of 0.3%, so frequent spam reports can block or filter email campaigns.
Email Users Statistics
- According to debounce.com, the global number of emails is projected to reach over 4,894 million by 2025.
- By 2026, the number is expected to reach 4,730 million, and by 2027, it will be 4,894 million.
Global Emails Per Day Statistics
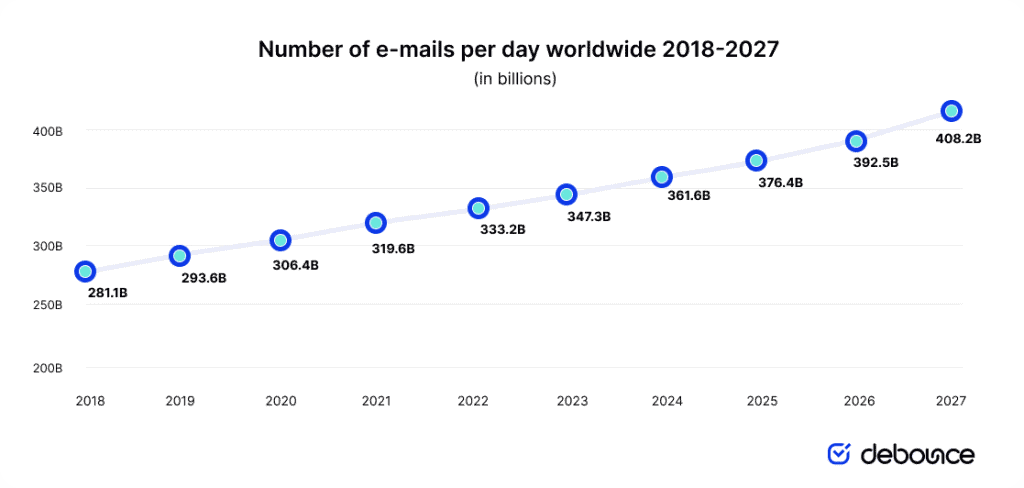
(Source: debounce)
- By 2025, the total number of emails sent and received per day is projected to reach approximately 376.4 billion.
- Global email volume is expected to reach 392.5 billion by 2026 and 408.2 billion by 2027.
Popular Mailbox Providers for Receiving Emails
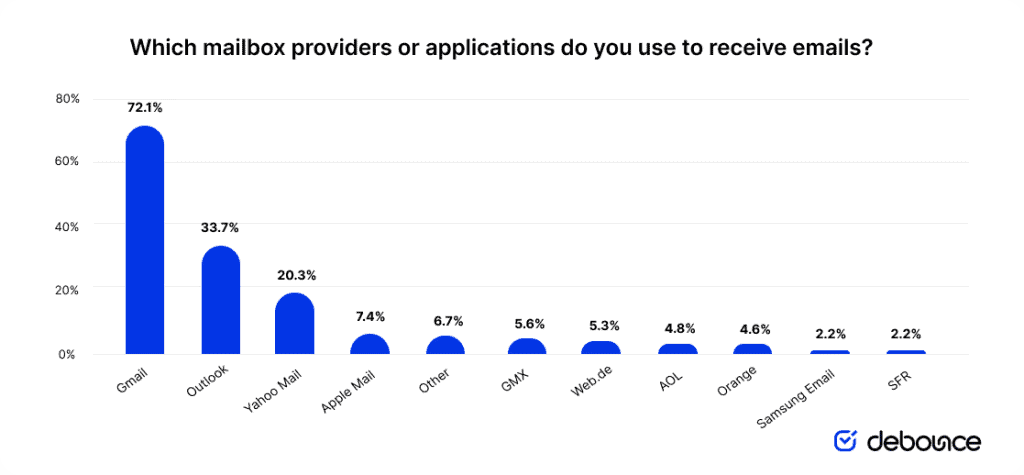
(Source: debounce)
- The above graphical analysis shows that Gmail is the most used mailbox provider, with 72.1% of users receiving emails in 2025.
- Meanwhile, Outlook is next at 33.7%, followed by Yahoo Mail (20.3%), Apple Mail (7.4%), GMX (5.6%), Web.de (5.3%), AOL (4.8%), Orange (4.6%), and both Samsung Email and SFR (2.2% each).
- Meanwhile, other providers together will account for 6.7%.
Types of Email Spam That Fill Inboxes Statistics
- A report published by emailwarmup.com states that marketing and advertising spam accounts for 36% of all spam, is generally low-risk yet highly annoying.
- Adult content spam accounts for 31.7% and carries a medium malware risk.
- Financial scam emails account for 26.5% of spam, which is a high risk of theft.
- Phishing accounts for 2.5% of spam but 73% of fraud emails, posing a critical risk to data.
Leading Sources of Spam Emails Statistics
- According to the Secure List 2025 report, Russia accounts for 36.18% of global spam emails.
- Mainland China ranks second at 17.11%, and the United States ranks third at 8.40%.
- Together, these three countries generate about 61.7% of global spam.
- Kaspersky Mail Anti-Virus stopped 125,521,794 spam email attachments from running in total.
- OOPSpam’s 2024 study says China and the US cause nearly 58% spam IPs, then Russia, Japan, and South Africa.
People’s Reaction to Spam Emails Statistics
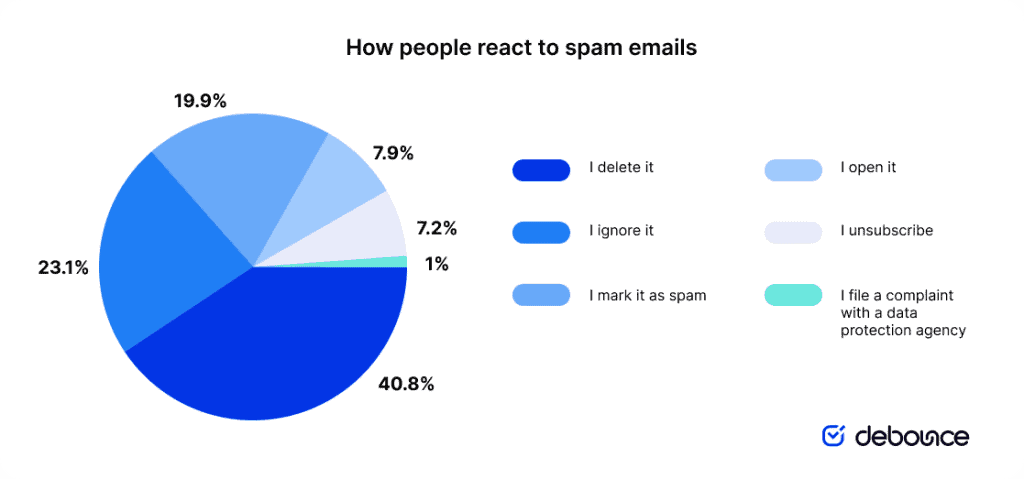
(Source: debounce)
- The above pie chart shows that 40.8% of people handle spam emails by deleting them, making this the most common response.
- Another 23.1% simply ignore spam, while 19.9% actively mark such messages as spam.
- Moreover, 7.9% actually open spam emails, and 7.2% use the unsubscribe option.
- Only 1% of people go further and file a complaint with a data protection agency.
Daily Volume of Spam Emails Statistics
(Source: emailwarmup.com)
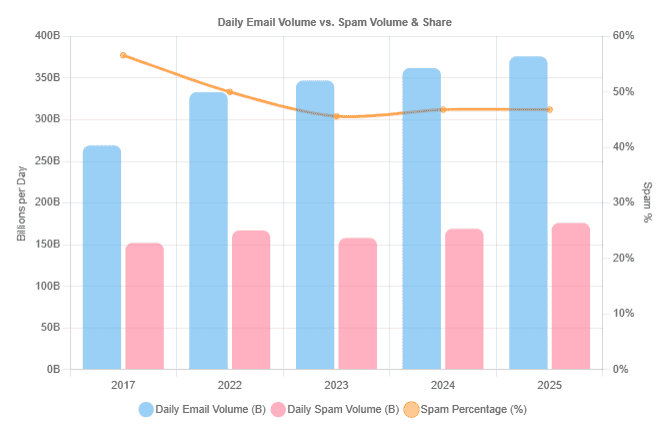
- In 2025, email traffic will reach 376 billion messages per day.
- Meanwhile, spam will account for 46.8%, representing approximately 176 billion emails.
The historical analysis is mentioned in the table below:
| Year | Daily Email Volume (billions per day) | Spam Share | Spam Volume(billions per day) |
| 2024 | 362 | 46.8% | 169 |
| 2023 | 347 | 45.6% | 158 |
| 2022 | 333 | 50% | 167 |
| 2017 | 269 | 56.6% | 152 |
(Source: amazonaws.com)
- About 52% of businesses claimed reducing spam is their primary email goal.
- Some researchers estimate that spam could account for 73% of global email traffic soon.
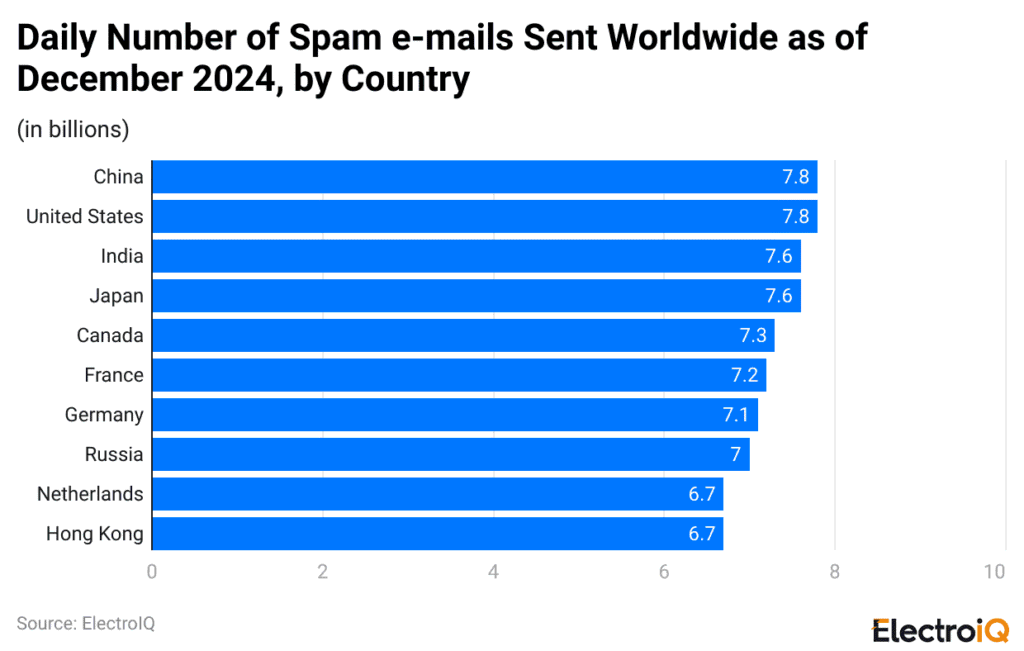
By Country
(Reference: statista.com)
- As of December 2024, China and the United States each have sent 7.8 billion spam emails per day.
- Meanwhile, India and Japan follow with 7.6 billion and 7.6 billion spam emails daily, respectively.
- Meanwhile, spam emails per day are followed by Canada (7.3 billion), France (7.2 billion), Germany (7.1 billion), Russia (7 billion), the Netherlands (6.7 billion), and Hong Kong (6.7 billion).
- In other countries, the lowest estimated daily volume is still around 3.8 billion spam emails.
Average Spam Email Delivery Rates by Sending Volume
- As of 2024, Spam rates vary with the number of emails sent; for 1 to 10,000 emails, the rate is about 21.64%, according to a report by debounce.com.
Furthermore, other email volume spam shares are followed by:
| Email Volume Range | Spam Rate |
| 10,001-50,000 | 25.76% |
| 50,001-200,000 | 29.31% |
| 200,001-1,000,000 | 21.29% |
| 1,000,000 & above | 16.24% |
Top Spam Email Topics
- As of 2025, the most common spam email topics are prizes or giveaways (36.7%), followed closely by job opportunities (36.3%) and banking messages (34.6%).
- Moreover, spam email topics are requests to change your password or update your account (28.7%), software download scams (23.2%), online gambling (21.1%), adult content spam (19%), cryptocurrency (17.3%), requests for money in exchange for a favor (17%), celebrity impersonation emails (12%), pharmaceuticals (11.3%), romance scams (10%).
- Meanwhile, the other remaining topics accounted for 8.9%.
Most Targeted Email Spam Statistics by Industries
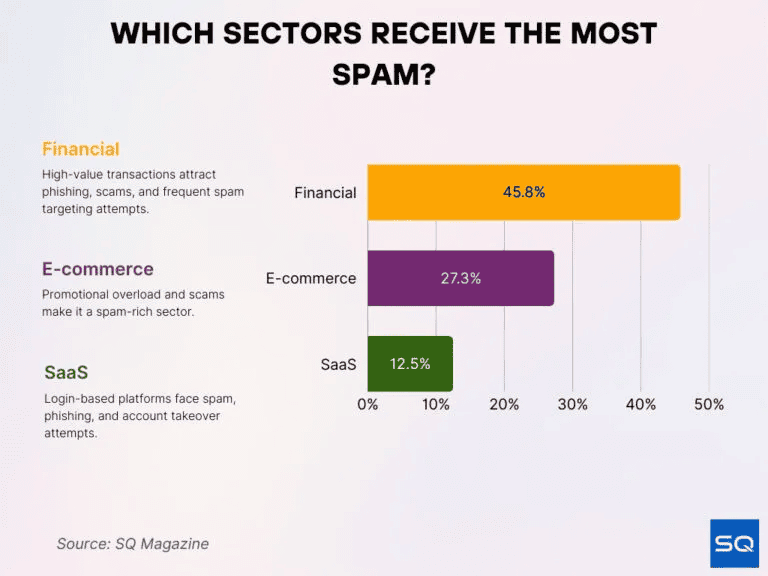
(Source: sqmagazine.co.uk)
- Financial services get 45.8% of spam attacks, the largest share, followed by e-commerce with 27.3%.
- Meanwhile, SaaS firms received 12.5% of email spam attempts.
- Dating emails have the highest spam rate at 14.97%.
- Followed by home, food, and clothing (10.6%), on WordPress (69%), sign up (45%), contact (35%), and e-commerce (15%).
Spam Share of Global Email Traffic Statistics
- In 2024, Securelist reported that 47.27% of all email messages worldwide were labelled as spam.
- AgainstData expects spam to account for roughly 45%-46% of global email traffic in 2025.
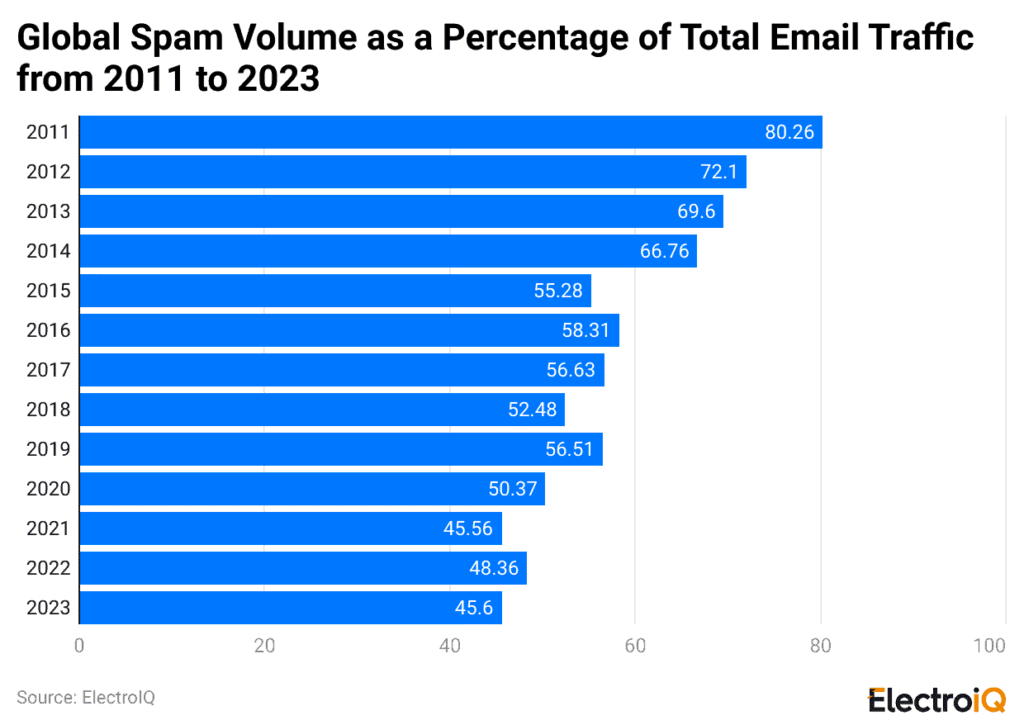
(Reference: statista.com)
- In 2023, about 45.6% of all global emails sent were marked as spam, down from nearly 49% in 2022.
Companies’ Cost of Email Spam Statistics
- A report from SQ Magazine stated that spam email costs companies about USD 20.5 billion in lost productivity every year.
- Each employee loses approximately 2 workdays annually dealing with junk mail, valued at about USD 1,934.
- Email spam represents only 2.5% of all emails, yet 73% of these messages involve identity theft.
- Gmail blocks more than 100 million unwanted messages each day, stopping 99.9% of spam, phishing, and malware.
Email Spam and Security Measures
- By 2025, Gmail will block more than 99.9% of spam, phishing, and malware before these messages reach a user’s inbox.
- Even with advanced security, almost 43% of professionals report employee distraction is a major problem, and phishing can still bypass multi-factor authentication to take over accounts.
- Organisations plan to allocate 45% of their security budgets to email security, followed by 37% (training), and 34% (cloud tools); lifting global spending from 193 billion in 2024 to 213 billion in 2025.
- Only 26% of organisations use AI-based defences, and NordVPN launched Android spam-call protection after scam losses jumped 33% in 2024.
Environmental Impacts of Email Spam Statistics
- According to emailtooltester.com, a short email sent and read on a phone produces 0.2 g of CO2, and a spam message caught by filters still creates about 0.03 g.
- The United States alone sends about 8 billion spam emails each day, creating 240 metric tonnes of CO2, or 87,600 metric tonnes over one year.
- Across the ten worst-offending countries, spam is responsible for 2,184 metric tonnes of CO2 per day and 797,160 metric tonnes annually.
- That is equivalent to driving 5.3 million miles per day in a standard gas car, or 1.9 billion miles per year.
Conclusion
The article on Email Spam Statistics indicates that unwanted messages are more than a minor annoyance. Such emails waste time, fill inboxes, also allow in open the door to phishing, malware, and money scams. The numbers also demonstrate the importance of effective spam filters, security checks, and basic user awareness in staying safe.
In recent years, spammers have employed new tactics and increasingly sophisticated tools; therefore, individuals and organisations must continually update their spam protection measures. Ultimately, safe email use requires constant vigilance, smart technology, and careful users in every place and situation.